mne.viz.plot_events
-
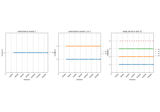
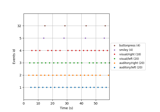
mne.viz.plot_events(events, sfreq=None, first_samp=0, color=None, event_id=None, axes=None, equal_spacing=True, show=True, on_missing='raise', verbose=None)[source]¶ Plot events to get a visual display of the paradigm.
- Parameters
- events
array, shape (n_events, 3) The events.
- sfreq
float|None The sample frequency. If None, data will be displayed in samples (not seconds).
- first_samp
int The index of the first sample. Recordings made on Neuromag systems number samples relative to the system start (not relative to the beginning of the recording). In such cases the
raw.first_sampattribute can be passed here. Default is 0.- color
dict|None Dictionary of event_id integers as keys and colors as values. If None, colors are automatically drawn from a default list (cycled through if number of events longer than list of default colors). Color can be any valid matplotlib color.
- event_id
dict|None Dictionary of event labels (e.g. ‘aud_l’) as keys and their associated event_id values. Labels are used to plot a legend. If None, no legend is drawn.
- axesinstance of
Axes The subplot handle.
- equal_spacingbool
Use equal spacing between events in y-axis.
- showbool
Show figure if True.
- on_missing
str Can be
'raise'(default) to raise an error,'warn'to emit a warning, or'ignore'to ignore when event numbers fromevent_idare missing fromevents. When numbers fromeventsare missing fromevent_idthey will be ignored and a warning emitted; consider usingverbose='error'in this case.New in version 0.21.
- verbosebool,
str,int, orNone If not None, override default verbose level (see
mne.verbose()and Logging documentation for more). If used, it should be passed as a keyword-argument only.
- events
- Returns
- fig
matplotlib.figure.Figure The figure object containing the plot.
- fig
Notes
New in version 0.9.0.