mne.viz.plot_head_positions
-
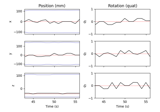
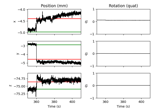
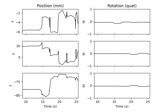
mne.viz.plot_head_positions(pos, mode='traces', cmap='viridis', direction='z', show=True, destination=None, info=None, color='k', axes=None)[source]¶ Plot head positions.
- Parameters
- pos
ndarray, shape (n_pos, 10) |listofndarray The head position data. Can also be a list to treat as a concatenation of runs.
- mode
str Can be ‘traces’ (default) to show position and quaternion traces, or ‘field’ to show the position as a vector field over time. The ‘field’ mode requires matplotlib 1.4+.
- cmapcolormap
Colormap to use for the trace plot, default is “viridis”.
- direction
str Can be any combination of “x”, “y”, or “z” (default: “z”) to show directional axes in “field” mode.
- showbool
Show figure if True. Defaults to True.
- destination
str| array_like, shape (3,) |None The destination location for the head, assumed to be in head coordinates. See
mne.preprocessing.maxwell_filter()for details.New in version 0.16.
- infoinstance of
mne.Info|None Measurement information. If provided, will be used to show the destination position when
destination is None, and for showing the MEG sensors.New in version 0.16.
- colorcolor object
The color to use for lines in
mode == 'traces'and quiver arrows inmode == 'field'.New in version 0.16.
- axesarray_like, shape (3, 2)
The matplotlib axes to use. Only used for
mode == 'traces'.New in version 0.16.
- pos
- Returns
- figinstance of
matplotlib.figure.Figure The figure.
- figinstance of