MNE-Connectivity
Examples demonstrating connectivity analysis in sensor and source space.
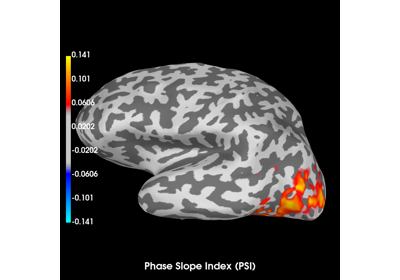
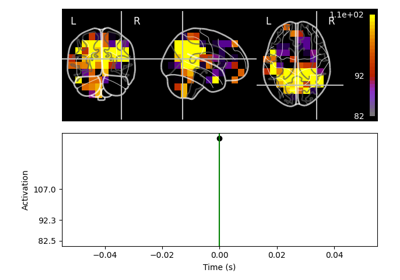
Compute Phase Slope Index (PSI) in source space for a visual stimulus
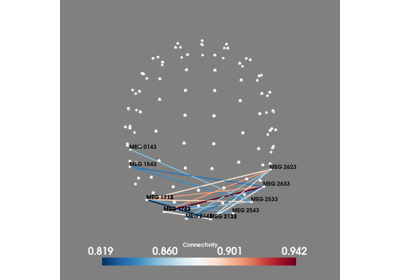
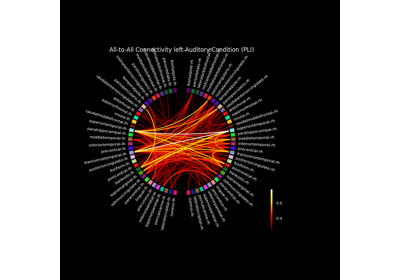
Compute all-to-all connectivity in sensor space
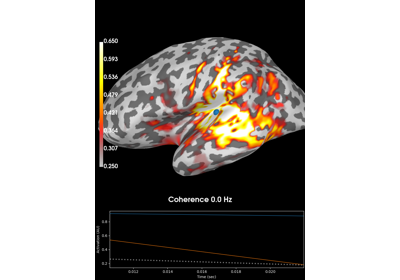
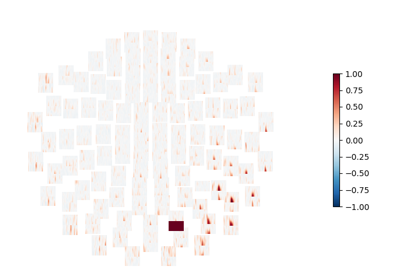
Compute coherence in source space using a MNE inverse solution
Compute envelope correlations in source space
Compute envelope correlations in volume source space
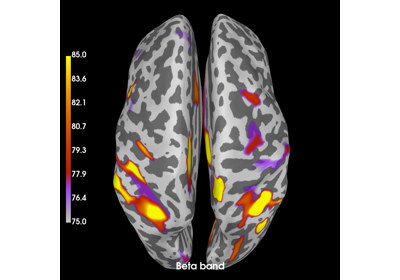
Compute full spectrum source space connectivity between labels
Compute mixed source space connectivity and visualize it using a circular graph
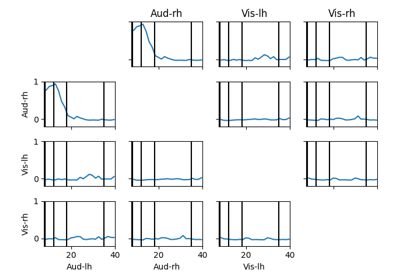
Compute seed-based time-frequency connectivity in sensor space
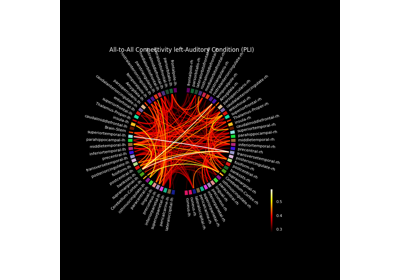
Compute source space connectivity and visualize it using a circular graph
Gallery generated by Sphinx-Gallery