
Note
Go to the end to download the full example code.
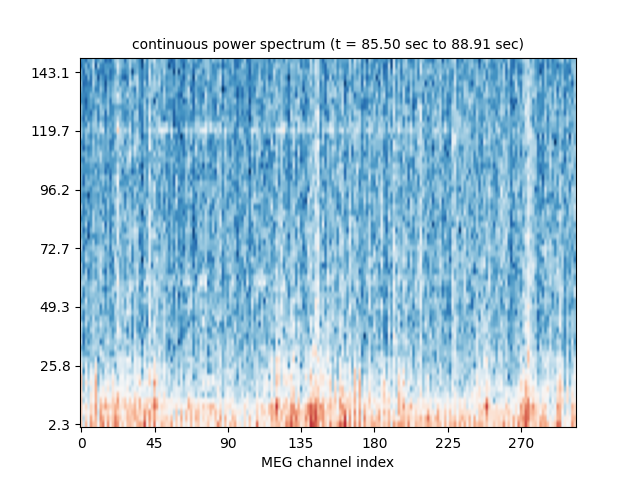
Compute real-time power spectrum density with FieldTrip client#
Please refer to ftclient_rt_average.py for instructions on how to get the FieldTrip connector working in MNE-Python.
This example demonstrates how to use it for continuous computation of power spectra in real-time using the get_data_as_epoch function.
    Read a total of 3 projection items:
        PCA-v1 (1 x 10²)  idle
        PCA-v2 (1 x 10²)  idle
        PCA-v3 (1 x 10²)  idle
Running subprocess: neuromag2ft --file /home/circleci/mne_data/MNE-sample-data/MEG/sample/sample_audvis_raw.fif --speed 10
FieldTripClient: Waiting for server to start
/home/circleci/project/mne_realtime/externals/FieldTrip.py:227: ResourceWarning: unclosed <socket.socket fd=16, family=2, type=1, proto=0, laddr=('0.0.0.0', 51820)>
  self.sock = socket.socket(socket.AF_INET, socket.SOCK_STREAM)
FieldTripClient: Connected
FieldTripClient: Retrieving header
FieldTripClient: Header retrieved
Not setting metadata
1 matching events found
No baseline correction applied
0 projection items activated
Effective window size : 0.426 (s)
Not setting metadata
1 matching events found
No baseline correction applied
0 projection items activated
Effective window size : 0.426 (s)
Not setting metadata
1 matching events found
No baseline correction applied
0 projection items activated
Effective window size : 0.426 (s)
Not setting metadata
1 matching events found
No baseline correction applied
0 projection items activated
Effective window size : 0.426 (s)
Not setting metadata
1 matching events found
No baseline correction applied
0 projection items activated
Effective window size : 0.426 (s)
# Author: Mainak Jas <mainak@neuro.hut.fi>
#
# License: BSD (3-clause)

import os.path as op
import subprocess
import time

import numpy as np
import matplotlib.pyplot as plt

import mne
from mne.utils import running_subprocess

from mne_realtime import FieldTripClient

print(__doc__)

# user should provide info and list of bad channels because
# FieldTrip header object does not provide them
data_path = mne.datasets.sample.data_path()
info = mne.io.read_info(op.join(data_path, 'MEG', 'sample',
                                'sample_audvis_raw.fif'))
bads = ['MEG 2443', 'EEG 053']

fig, ax = plt.subplots(1)

speedup = 10
command = ["neuromag2ft", "--file",
           "{}/MEG/sample/sample_audvis_raw.fif".format(data_path),
           "--speed", str(speedup)]
with running_subprocess(command, after='kill',
                        stdout=subprocess.PIPE, stderr=subprocess.PIPE):
    with FieldTripClient(host='localhost', port=1972,
                         tmax=10, wait_max=5, info=info) as rt_client:

        # select gradiometers
        picks = mne.pick_types(info, meg='grad', eeg=False, eog=True,
                               stim=False, include=[], exclude=bads)

        n_fft = 256  # the FFT size. Ideally a power of 2
        n_samples = 2048  # time window on which to compute FFT

        # make sure at least one epoch is available
        time.sleep(n_samples / info['sfreq'])

        for ii in range(5):
            epoch = rt_client.get_data_as_epoch(n_samples=n_samples,
                                                picks=picks)
            spectrum = epoch.compute_psd(method='welch', fmin=2, fmax=200, n_fft=n_fft)
            psd, freqs = spectrum.get_data(return_freqs=True)

            cmap = 'RdBu_r'
            freq_mask = freqs < 150
            freqs = freqs[freq_mask]
            log_psd = 10 * np.log10(psd[0])

            tmin = epoch.events[0][0] / info['sfreq']
            tmax = (epoch.events[0][0] + n_samples) / info['sfreq']

            if ii == 0:
                im = ax.imshow(log_psd[:, freq_mask].T, aspect='auto',
                               origin='lower', cmap=cmap)

                ax.set_yticks(np.arange(0, len(freqs), 10))
                ax.set_yticklabels(freqs[::10].round(1))
                ax.set_xlabel('Frequency (Hz)')
                ax.set_xticks(np.arange(0, len(picks), 30))
                ax.set_xticklabels(picks[::30])
                ax.set_xlabel('MEG channel index')
                im.set_clim()
            else:
                im.set_data(log_psd[:, freq_mask].T)

            plt.title('continuous power spectrum (t = %0.2f sec to %0.2f sec)'
                      % (tmin, tmax), fontsize=10)

            plt.pause(0.5 / speedup)
Total running time of the script: (0 minutes 11.421 seconds)
Estimated memory usage: 192 MB