Note
Click here to download the full example code
Find EOG artifacts
Locate peaks of EOG to spot blinks and general EOG artifacts.
# Authors: Alexandre Gramfort <alexandre.gramfort@inria.fr>
#
# License: BSD (3-clause)


import numpy as np
import matplotlib.pyplot as plt

import mne
from mne import io
from mne.datasets import sample

print(__doc__)

data_path = sample.data_path()
Set parameters
raw_fname = data_path + '/MEG/sample/sample_audvis_filt-0-40_raw.fif'

# Setup for reading the raw data
raw = io.read_raw_fif(raw_fname)

event_id = 998
eog_events = mne.preprocessing.find_eog_events(raw, event_id)

# Read epochs
picks = mne.pick_types(raw.info, meg=False, eeg=False, stim=False, eog=True,
                       exclude='bads')
tmin, tmax = -0.2, 0.2
epochs = mne.Epochs(raw, eog_events, event_id, tmin, tmax, picks=picks)
data = epochs.get_data()

print("Number of detected EOG artifacts : %d" % len(data))
Out:
Opening raw data file /home/circleci/mne_data/MNE-sample-data/MEG/sample/sample_audvis_filt-0-40_raw.fif...
    Read a total of 4 projection items:
        PCA-v1 (1 x 10²)  idle
        PCA-v2 (1 x 10²)  idle
        PCA-v3 (1 x 10²)  idle
        Average EEG reference (1 x 60)  idle
    Range : 6450 ... 48149 =     42.956 ...   320.665 secs
Ready.
EOG channel index for this subject is: [375]
Filtering the data to remove DC offset to help distinguish blinks from saccades
Setting up band-pass filter from 1 - 10 Hz

FIR filter parameters
---------------------
Designing a two-pass forward and reverse, zero-phase, non-causal bandpass filter:
- Windowed frequency-domain design (firwin2) method
- Hann window
- Lower passband edge: 1.00
- Lower transition bandwidth: 0.50 Hz (-12 dB cutoff frequency: 0.75 Hz)
- Upper passband edge: 10.00 Hz
- Upper transition bandwidth: 0.50 Hz (-12 dB cutoff frequency: 10.25 Hz)
- Filter length: 1502 samples (10.003 sec)

Now detecting blinks and generating corresponding events
Found 46 significant peaks
Number of EOG events detected : 46
Not setting metadata
Not setting metadata
46 matching events found
Applying baseline correction (mode: mean)
4 projection items activated
Loading data for 46 events and 61 original time points ...
0 bad epochs dropped
Number of detected EOG artifacts : 46
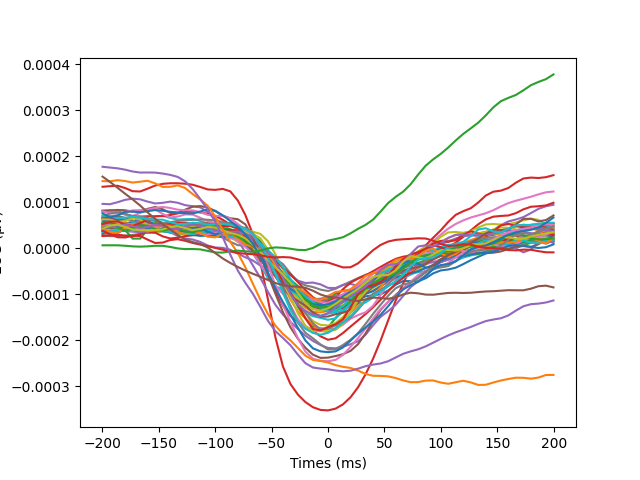
Plot EOG artifacts
plt.plot(1e3 * epochs.times, np.squeeze(data).T)
plt.xlabel('Times (ms)')
plt.ylabel('EOG (µV)')
plt.show()
Total running time of the script: ( 0 minutes 1.936 seconds)
Estimated memory usage: 8 MB