Note
Click here to download the full example code
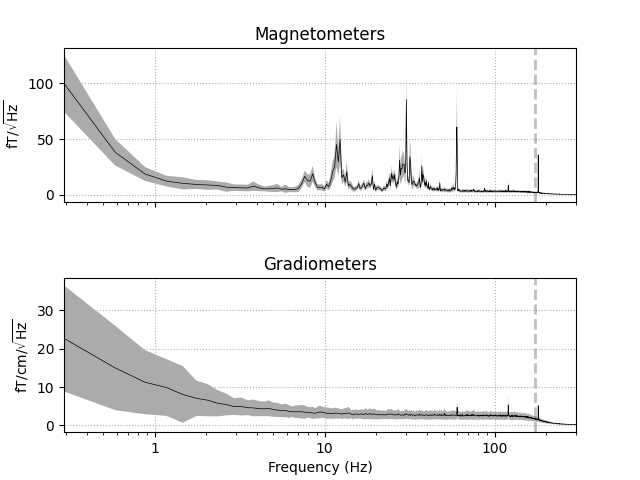
Show noise levels from empty room data
This shows how to use mne.io.Raw.plot_psd() to examine noise levels
of systems. See 1 for an example.
References
- 1
Khan S, Cohen D (2013). Note: Magnetic noise from the inner wall of a magnetically shielded room. Review of Scientific Instruments 84:56101. https://doi.org/10.1063/1.4802845
# Author: Eric Larson <larson.eric.d@gmail.com>
#
# License: BSD (3-clause)

import os.path as op
import mne

data_path = mne.datasets.sample.data_path()

raw_erm = mne.io.read_raw_fif(op.join(data_path, 'MEG', 'sample',
                                      'ernoise_raw.fif'), preload=True)
Out:
Opening raw data file /home/circleci/mne_data/MNE-sample-data/MEG/sample/ernoise_raw.fif...
Isotrak not found
    Read a total of 3 projection items:
        PCA-v1 (1 x 10²)  idle
        PCA-v2 (1 x 10²)  idle
        PCA-v3 (1 x 10²)  idle
    Range : 19800 ... 85867 =     32.966 ...   142.965 secs
Ready.
Reading 0 ... 66067  =      0.000 ...   109.999 secs...
We can plot the absolute noise levels:
raw_erm.plot_psd(tmax=10., average=True, spatial_colors=False,
                 dB=False, xscale='log')
Out:
Effective window size : 3.410 (s)
Effective window size : 3.410 (s)
Total running time of the script: ( 0 minutes 1.695 seconds)
Estimated memory usage: 167 MB