Note
Click here to download the full example code
Working with Epoch metadata
This tutorial shows how to add metadata to Epochs objects, and
how to use Pandas query strings to select and
plot epochs based on metadata properties.
Page contents
For this tutorial we’ll use a different dataset than usual: the
Kiloword dataset, which contains EEG data averaged across 75 subjects
who were performing a lexical decision (word/non-word) task. The data is in
Epochs format, with each epoch representing the response to a
different stimulus (word). As usual we’ll start by importing the modules we
need and loading the data:
import os
import numpy as np
import pandas as pd
import mne

kiloword_data_folder = mne.datasets.kiloword.data_path()
kiloword_data_file = os.path.join(kiloword_data_folder,
                                  'kword_metadata-epo.fif')
epochs = mne.read_epochs(kiloword_data_file)
Out:
Reading /home/circleci/mne_data/MNE-kiloword-data/kword_metadata-epo.fif ...
Isotrak not found
    Found the data of interest:
        t =    -100.00 ...     920.00 ms
        0 CTF compensation matrices available
Adding metadata with 8 columns
Replacing existing metadata with 8 columns
960 matching events found
No baseline correction applied
0 projection items activated
Viewing Epochs metadata
The metadata attached to Epochs objects is stored as a
pandas.DataFrame containing one row for each epoch. The columns of
this DataFrame can contain just about any information you
want to store about each epoch; in this case, the metadata encodes
information about the stimulus seen on each trial, including properties of
the visual word form itself (e.g., NumberOfLetters, VisualComplexity)
as well as properties of what the word means (e.g., its Concreteness) and
its prominence in the English lexicon (e.g., WordFrequency). Here are all
the variables; note that in a Jupyter notebook, viewing a
pandas.DataFrame gets rendered as an HTML table instead of the
normal Python output block:
Viewing the metadata values for a given epoch and metadata variable is done
using any of the Pandas indexing
methods such as loc,
iloc, at,
and iat. Because the
index of the dataframe is the integer epoch number, the name- and index-based
selection methods will work similarly for selecting rows, except that
name-based selection (with loc) is inclusive of the
endpoint:
print('Name-based selection with .loc')
print(epochs.metadata.loc[2:4])

print('\nIndex-based selection with .iloc')
print(epochs.metadata.iloc[2:4])
Out:
Name-based selection with .loc
   WORD  ...  VisualComplexity
2  shot  ...         64.600033
3  cold  ...         63.657457
4  main  ...         68.945661

[3 rows x 8 columns]

Index-based selection with .iloc
   WORD  ...  VisualComplexity
2  shot  ...         64.600033
3  cold  ...         63.657457

[2 rows x 8 columns]
Modifying the metadata
Like any pandas.DataFrame, you can modify the data or add columns as
needed. Here we convert the NumberOfLetters column from float to
integer data type, and add a boolean column
that arbitrarily divides the variable VisualComplexity into high and low
groups.
epochs.metadata['NumberOfLetters'] = \
    epochs.metadata['NumberOfLetters'].map(int)

epochs.metadata['HighComplexity'] = epochs.metadata['VisualComplexity'] > 65
epochs.metadata.head()
Selecting epochs using metadata queries
All Epochs objects can be subselected by event name, index, or
slice (see Subselecting epochs). But
Epochs objects with metadata can also be queried using
Pandas query strings by passing the query
string just as you would normally pass an event name. For example:
print(epochs['WORD.str.startswith("dis")'])
Out:
<EpochsFIF |  8 events (all good), -0.1 - 0.92 sec, baseline off, ~523 kB, data loaded, with metadata,
 'disarray': 1
 'disaster': 1
 'discord': 1
 'disease': 1
 'display': 1
 'disposal': 1
 'distance': 1
 'district': 1>
This capability uses the pandas.DataFrame.query() method under the
hood, so you can check out the documentation of that method to learn how to
format query strings. Here’s another example:
print(epochs['Concreteness > 6 and WordFrequency < 1'])
Out:
<EpochsFIF |  4 events (all good), -0.1 - 0.92 sec, baseline off, ~291 kB, data loaded, with metadata,
 'banjo': 1
 'corsage': 1
 'lasso': 1
 'tentacle': 1>
Note also that traditional epochs subselection by condition name still works; MNE-Python will try the traditional method first before falling back on rich metadata querying.
epochs['solenoid'].plot_psd()
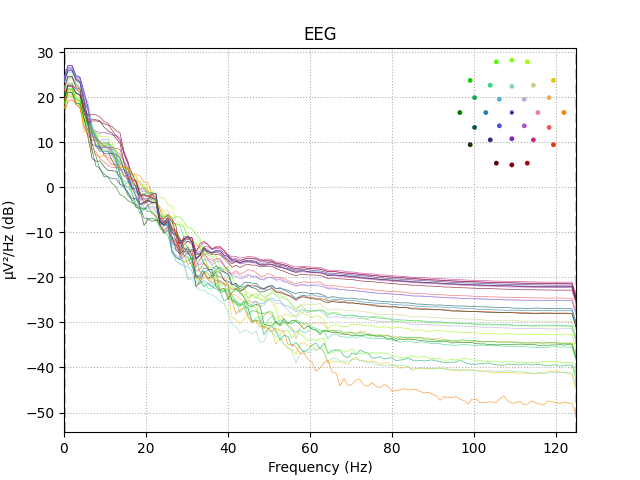
Out:
Using multitaper spectrum estimation with 7 DPSS windows
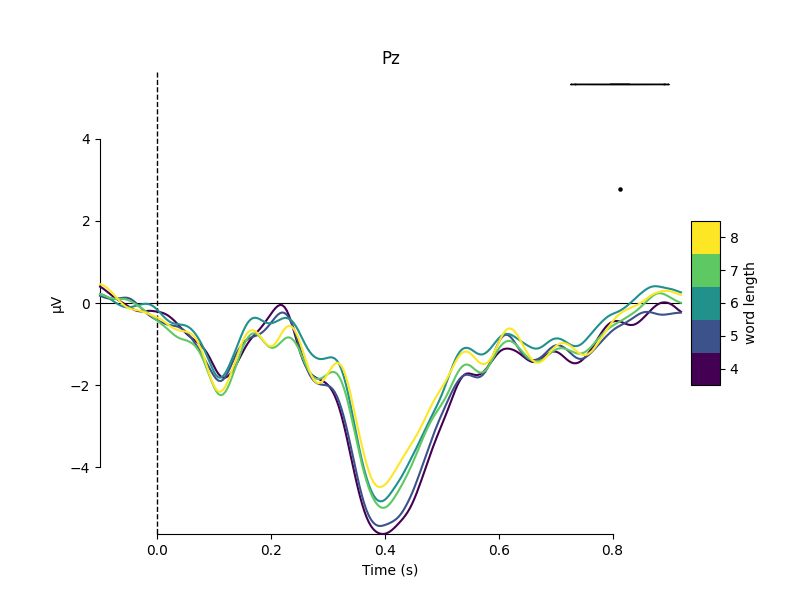
One use of the Pandas query string approach is to select specific words for plotting:
Notice that in this dataset, each “condition” (A.K.A., each word) occurs only
once, whereas with the Sample dataset each condition (e.g.,
“auditory/left”, “visual/right”, etc) occurred dozens of times. This makes
the Pandas querying methods especially useful when you want to aggregate
epochs that have different condition names but that share similar stimulus
properties. For example, here we group epochs based on the number of letters
in the stimulus word, and compare the average signal at electrode Pz for
each group:
evokeds = dict()
query = 'NumberOfLetters == {}'
for n_letters in epochs.metadata['NumberOfLetters'].unique():
    evokeds[str(n_letters)] = epochs[query.format(n_letters)].average()

mne.viz.plot_compare_evokeds(evokeds, cmap=('word length', 'viridis'),
                             picks='Pz')
Metadata can also be useful for sorting the epochs in an image plot. For example, here we order the epochs based on word frequency to see if there’s a pattern to the latency or intensity of the response:
sort_order = np.argsort(epochs.metadata['WordFrequency'])
epochs.plot_image(order=sort_order, picks='Pz')
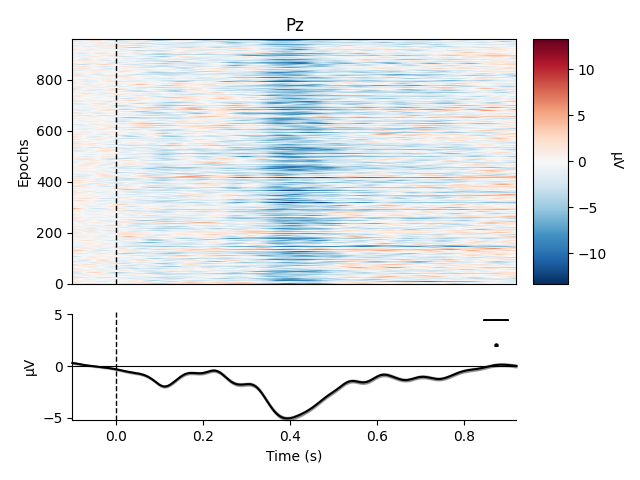
Out:
Not setting metadata
Not setting metadata
960 matching events found
No baseline correction applied
0 projection items activated
0 bad epochs dropped
Although there’s no obvious relationship in this case, such analyses may be useful for metadata variables that more directly index the time course of stimulus processing (such as reaction time).
Adding metadata to an Epochs object
You can add a metadata DataFrame to any
Epochs object (or replace existing metadata) simply by
assigning to the metadata attribute:
new_metadata = pd.DataFrame(data=['foo'] * len(epochs), columns=['bar'],
                            index=range(len(epochs)))
epochs.metadata = new_metadata
epochs.metadata.head()
Out:
Replacing existing metadata with 1 columns
You can remove metadata from an Epochs object by setting its
metadata to None:
epochs.metadata = None
Out:
Removing existing metadata
Total running time of the script: ( 0 minutes 16.779 seconds)
Estimated memory usage: 62 MB