mne.Dipole
-
class
mne.Dipole(times, pos, amplitude, ori, gof, name=None, conf=None, khi2=None, nfree=None, verbose=None)[source]¶ Dipole class for sequential dipole fits.
Note
This class should usually not be instantiated directly, instead
mne.read_dipole()should be used.Used to store positions, orientations, amplitudes, times, goodness of fit of dipoles, typically obtained with Neuromag/xfit, mne_dipole_fit or certain inverse solvers. Note that dipole position vectors are given in the head coordinate frame.
- Parameters
- times
array, shape (n_dipoles,) The time instants at which each dipole was fitted (sec).
- pos
array, shape (n_dipoles, 3) The dipoles positions (m) in head coordinates.
- amplitude
array, shape (n_dipoles,) The amplitude of the dipoles (Am).
- ori
array, shape (n_dipoles, 3) The dipole orientations (normalized to unit length).
- gof
array, shape (n_dipoles,) The goodness of fit.
- name
str|None Name of the dipole.
- conf
dict Confidence limits in dipole orientation for “vol” in m^3 (volume), “depth” in m (along the depth axis), “long” in m (longitudinal axis), “trans” in m (transverse axis), “qlong” in Am, and “qtrans” in Am (currents). The current confidence limit in the depth direction is assumed to be zero (although it can be non-zero when a BEM is used).
New in version 0.15.
- khi2
array, shape (n_dipoles,) The χ^2 values for the fits.
New in version 0.15.
- nfree
array, shape (n_dipoles,) The number of free parameters for each fit.
New in version 0.15.
- verbosebool,
str,int, orNone If not None, override default verbose level (see
mne.verbose()and Logging documentation for more). If used, it should be passed as a keyword-argument only.
- times
See also
Notes
This class is for sequential dipole fits, where the position changes as a function of time. For fixed dipole fits, where the position is fixed as a function of time, use
mne.DipoleFixed.Methods
__getitem__(item)Get a time slice.
__hash__(/)Return hash(self).
__len__()Return the number of dipoles.
copy()Copy the Dipoles object.
crop([tmin, tmax, include_tmax])Crop data to a given time interval.
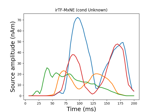
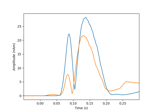
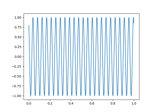
plot_amplitudes([color, show])Plot the dipole amplitudes as a function of time.
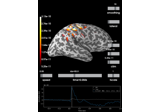
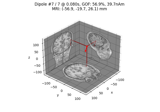
plot_locations(trans, subject[, …])Plot dipole locations in 3d.
save(fname[, overwrite])Save dipole in a .dip or .bdip file.
-
__getitem__(item)[source]¶ Get a time slice.
- Parameters
- itemarray_like or
slice The slice of time points to use.
- itemarray_like or
- Returns
- dipinstance of
Dipole The sliced dipole.
- dipinstance of
-
__len__()[source]¶ Return the number of dipoles.
- Returns
- len
int The number of dipoles.
- len
Examples
This can be used as:
>>> len(dipoles)
10
-
crop(tmin=None, tmax=None, include_tmax=True)[source]¶ Crop data to a given time interval.
- Parameters
- Returns
- selfinstance of
Dipole The cropped instance.
- selfinstance of
Examples using
crop:
-
plot_amplitudes(color='k', show=True)[source]¶ Plot the dipole amplitudes as a function of time.
- Parameters
- Returns
- fig
matplotlib.figure.Figure The figure object containing the plot.
- fig
-
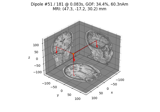
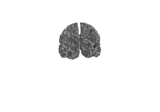
plot_locations(trans, subject, subjects_dir=None, mode='orthoview', coord_frame='mri', idx='gof', show_all=True, ax=None, block=False, show=True, scale=0.005, color=(1.0, 0.0, 0.0), fig=None, verbose=None, title=None)[source]¶ Plot dipole locations in 3d.
- Parameters
- trans
dict The mri to head trans.
- subject
str The subject name corresponding to FreeSurfer environment variable SUBJECT.
- subjects_dir
str|None The path to the freesurfer subjects reconstructions. It corresponds to Freesurfer environment variable SUBJECTS_DIR.
- mode
str Can be
'arrow','sphere'or'orthoview'.New in version 0.14.0.
- coord_frame
str Coordinate frame to use, ‘head’ or ‘mri’. Defaults to ‘mri’.
New in version 0.14.0.
- idx
int| ‘gof’ | ‘amplitude’ Index of the initially plotted dipole. Can also be ‘gof’ to plot the dipole with highest goodness of fit value or ‘amplitude’ to plot the dipole with the highest amplitude. The dipoles can also be browsed through using up/down arrow keys or mouse scroll. Defaults to ‘gof’. Only used if mode equals ‘orthoview’.
New in version 0.14.0.
- show_allbool
Whether to always plot all the dipoles. If True (default), the active dipole is plotted as a red dot and it’s location determines the shown MRI slices. The the non-active dipoles are plotted as small blue dots. If False, only the active dipole is plotted. Only used if mode equals ‘orthoview’.
New in version 0.14.0.
- axinstance of matplotlib
Axes3D|None Axes to plot into. If None (default), axes will be created. Only used if mode equals ‘orthoview’.
New in version 0.14.0.
- blockbool
Whether to halt program execution until the figure is closed. Defaults to False. Only used if mode equals ‘orthoview’.
New in version 0.14.0.
- showbool
Show figure if True. Defaults to True. Only used if mode equals ‘orthoview’.
- scale
float The scale of the dipoles if
modeis ‘arrow’ or ‘sphere’.- color
tuple The color of the dipoles if
modeis ‘arrow’ or ‘sphere’.- fig
mayavi.mlab.Figure|None Mayavi Scene in which to plot the alignment. If
None, creates a new 600x600 pixel figure with black background.New in version 0.14.0.
- verbosebool,
str,int, orNone If not None, override default verbose level (see
mne.verbose()and Logging documentation for more). If used, it should be passed as a keyword-argument only. Defaults to self.verbose.- title
str|None The title of the figure if
mode='orthoview'(ignored for all other modes). IfNone, dipole number and its properties (amplitude, orientation etc.) will be shown. Defaults toNone.New in version 0.21.0.
- trans
- Returns
- figinstance of
mayavi.mlab.Figureormatplotlib.figure.Figure The mayavi figure or matplotlib Figure.
- figinstance of
Notes
New in version 0.9.0.
Examples using
plot_locations: