mne.viz.plot_layout
-
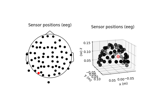
mne.viz.plot_layout(layout, picks=None, show=True)[source]¶ Plot the sensor positions.
- Parameters
- layout
None|Layout Layout instance specifying sensor positions.
- picks
list|slice|None Channels to include. Slices and lists of integers will be interpreted as channel indices. None (default) will pick all channels. Note that channels in
info['bads']will be included if their indices are explicitly provided.- showbool
Show figure if True. Defaults to True.
- layout
- Returns
- figinstance of
Figure Figure containing the sensor topography.
- figinstance of
Notes
New in version 0.12.0.