0.22.1
  • Install
  • Overview
  • Tutorials
  • Examples
  • Glossary
  • API
  • More
    • GitHub
    • Get help
    • Contribute
    • Cite MNE
    • Development
    • v0.22 (stable)
    • v0.21
    • v0.20
    • v0.19
    • v0.18
    • v0.17
    • v0.16
    • v0.15
    • v0.14
    • v0.13
    • v0.12
    • v0.11

Examples Gallery

The examples gallery provides working code samples demonstrating various analysis and visualization techniques. These examples often lack the narrative explanations seen in the tutorials, and do not follow any specific order. These examples are a useful way to discover new analysis or plotting ideas, or to see how a particular technique you’ve read about can be applied using MNE-Python.

Warning

These examples sometimes use simulations or shortcuts (such as intentionally adding noise to recordings) to illustrate a point. Use caution when copy-pasting code samples.
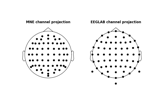
Input/Output

Recipes for reading and writing files. See also our tutorials on reading data from various recording systems and our tutorial on manipulating MNE-Python data structures.

Getting averaging info from .fif files

Getting averaging info from .fif files

How to use data in neural ensemble (NEO) format

How to use data in neural ensemble (NEO) format

Reading/Writing a noise covariance matrix

Reading/Writing a noise covariance matrix

Data Simulation

Tools to generate simulation data.

Generate simulated evoked data

Generate simulated evoked data

Generate simulated raw data

Generate simulated raw data

Simulate raw data using subject anatomy

Simulate raw data using subject anatomy

Generate simulated source data

Generate simulated source data

Preprocessing

Examples related to data preprocessing (artifact detection / rejection etc.)
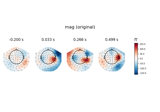
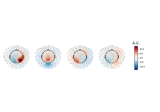
Define target events based on time lag, plot evoked response

Define target events based on time lag, plot evoked response

Transform EEG data using current source density (CSD)

Transform EEG data using current source density (CSD)

Show EOG artifact timing

Show EOG artifact timing

Find MEG reference channel artifacts

Find MEG reference channel artifacts

Visualise NIRS artifact correction methods

Visualise NIRS artifact correction methods

Compare the different ICA algorithms in MNE

Compare the different ICA algorithms in MNE

Interpolate bad channels for MEG/EEG channels

Interpolate bad channels for MEG/EEG channels

Maxwell filter data with movement compensation

Maxwell filter data with movement compensation

Annotate movement artifacts and reestimate dev_head_t

Annotate movement artifacts and reestimate dev_head_t

Annotate muscle artifacts

Annotate muscle artifacts

Plot sensor denoising using oversampled temporal projection

Plot sensor denoising using oversampled temporal projection

Compute ICA components on epochs

Compute ICA components on epochs

Shifting time-scale in evoked data

Shifting time-scale in evoked data

Remap MEG channel types

Remap MEG channel types

XDAWN Denoising

XDAWN Denoising

Visualization

Looking at data and processing output.

Plotting sensor layouts of EEG systems

Plotting sensor layouts of EEG systems

How to convert 3D electrode positions to a 2D image.

How to convert 3D electrode positions to a 2D image.

Visualize channel over epochs as an image

Visualize channel over epochs as an image

Plotting EEG sensors on the scalp

Plotting EEG sensors on the scalp

How to plot topomaps the way EEGLAB does

How to plot topomaps the way EEGLAB does

Plotting topographic arrowmaps of evoked data

Plotting topographic arrowmaps of evoked data

Plotting topographic maps of evoked data

Plotting topographic maps of evoked data

Whitening evoked data with a noise covariance

Whitening evoked data with a noise covariance

Make an MNE-Report with a Slider

Make an MNE-Report with a Slider

Plotting sensor layouts of MEG systems

Plotting sensor layouts of MEG systems

Plot the MNE brain and helmet

Plot the MNE brain and helmet

Plot a cortical parcellation

Plot a cortical parcellation

Make figures more publication ready

Make figures more publication ready

Plot single trial activity, grouped by ROI and sorted by RT

Plot single trial activity, grouped by ROI and sorted by RT

Show noise levels from empty room data

Show noise levels from empty room data

Sensitivity map of SSP projections

Sensitivity map of SSP projections

Compare evoked responses for different conditions

Compare evoked responses for different conditions

Plot custom topographies for MEG sensors

Plot custom topographies for MEG sensors

Cross-hemisphere comparison

Cross-hemisphere comparison

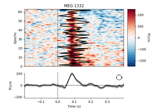
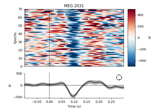
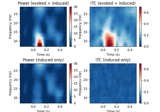
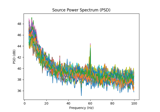
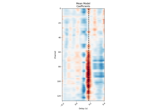
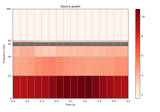
Time-Frequency Examples

Some examples of how to explore time-frequency content of M/EEG data with MNE.
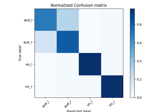
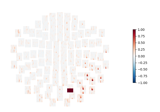
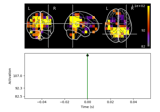
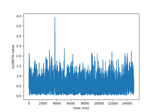
Compute a cross-spectral density (CSD) matrix

Compute a cross-spectral density (CSD) matrix

Compute Power Spectral Density of inverse solution from single epochs

Compute Power Spectral Density of inverse solution from single epochs

Compute power and phase lock in label of the source space

Compute power and phase lock in label of the source space

Compute source power spectral density (PSD) in a label

Compute source power spectral density (PSD) in a label

Compute source power spectral density (PSD) of VectorView and OPM data

Compute source power spectral density (PSD) of VectorView and OPM data

Compute induced power in the source space with dSPM

Compute induced power in the source space with dSPM

Temporal whitening with AR model

Temporal whitening with AR model

Compute and visualize ERDS maps

Compute and visualize ERDS maps

Explore event-related dynamics for specific frequency bands

Explore event-related dynamics for specific frequency bands

Time-frequency on simulated data (Multitaper vs. Morlet vs. Stockwell)

Time-frequency on simulated data (Multitaper vs. Morlet vs. Stockwell)

Statistics Examples

Some examples of how to compute statistics on M/EEG data with MNE.
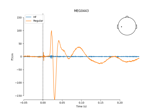
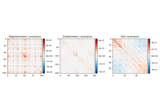
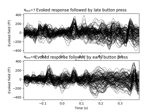
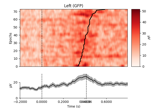
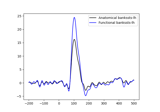
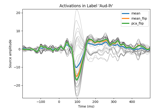
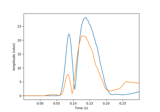
Permutation F-test on sensor data with 1D cluster level

Permutation F-test on sensor data with 1D cluster level

FDR correction on T-test on sensor data

FDR correction on T-test on sensor data

Regression on continuous data (rER[P/F])

Regression on continuous data (rER[P/F])

Permutation T-test on sensor data

Permutation T-test on sensor data

Analysing continuous features with binning and regression in sensor space

Analysing continuous features with binning and regression in sensor space

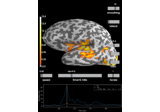
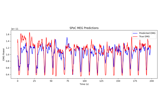
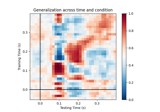
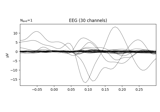
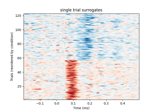
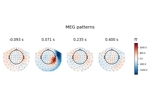
Machine Learning (Decoding, Encoding, and MVPA)

Decoding, encoding, and general machine learning examples.

Representational Similarity Analysis

Representational Similarity Analysis

Motor imagery decoding from EEG data using the Common Spatial Pattern (CSP)

Motor imagery decoding from EEG data using the Common Spatial Pattern (CSP)

Decoding in time-frequency space using Common Spatial Patterns (CSP)

Decoding in time-frequency space using Common Spatial Patterns (CSP)

Decoding source space data

Decoding source space data

Continuous Target Decoding with SPoC

Continuous Target Decoding with SPoC

Decoding sensor space data with generalization across time and conditions

Decoding sensor space data with generalization across time and conditions

Analysis of evoked response using ICA and PCA reduction techniques

Analysis of evoked response using ICA and PCA reduction techniques

XDAWN Decoding From EEG data

XDAWN Decoding From EEG data

Compute effect-matched-spatial filtering (EMS)

Compute effect-matched-spatial filtering (EMS)

Linear classifier on sensor data with plot patterns and filters

Linear classifier on sensor data with plot patterns and filters

Receptive Field Estimation and Prediction

Receptive Field Estimation and Prediction

Compute Sepctro-Spatial Decomposition (SSD) spatial filters

Compute Sepctro-Spatial Decomposition (SSD) spatial filters

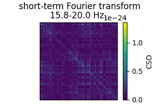
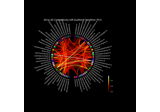
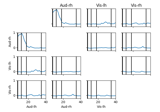
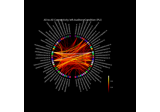
Connectivity Analysis Examples

Examples demonstrating connectivity analysis in sensor and source space.
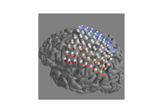
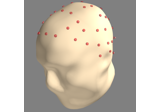
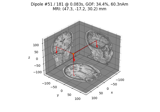
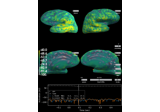
Compute seed-based time-frequency connectivity in sensor space

Compute seed-based time-frequency connectivity in sensor space

Compute mixed source space connectivity and visualize it using a circular graph

Compute mixed source space connectivity and visualize it using a circular graph

Compute coherence in source space using a MNE inverse solution

Compute coherence in source space using a MNE inverse solution

Compute full spectrum source space connectivity between labels

Compute full spectrum source space connectivity between labels

Compute envelope correlations in source space

Compute envelope correlations in source space

Compute envelope correlations in volume source space

Compute envelope correlations in volume source space

Compute source space connectivity and visualize it using a circular graph

Compute source space connectivity and visualize it using a circular graph

Compute Phase Slope Index (PSI) in source space for a visual stimulus

Compute Phase Slope Index (PSI) in source space for a visual stimulus

Compute all-to-all connectivity in sensor space

Compute all-to-all connectivity in sensor space

Forward modeling

From BEM segmentation, coregistration, setting up source spaces to actual computation of forward solution.

Display sensitivity maps for EEG and MEG sensors

Display sensitivity maps for EEG and MEG sensors

Generate a left cerebellum volume source space

Generate a left cerebellum volume source space

Use source space morphing

Use source space morphing

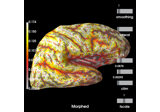
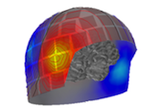
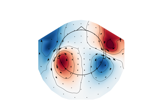
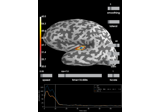
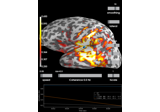
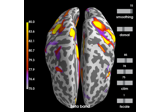
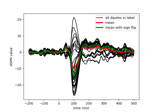
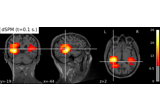
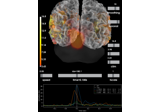
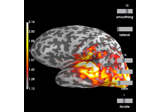
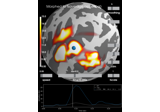
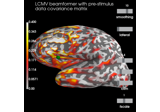
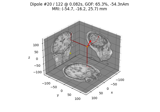
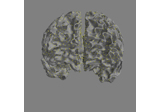
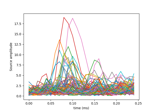
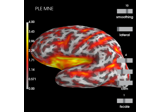
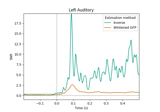
Inverse problem and source analysis

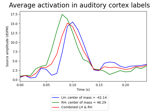
Estimate source activations, extract activations in labels, morph data between subjects etc.

Compute MNE-dSPM inverse solution on single epochs

Compute MNE-dSPM inverse solution on single epochs

Compute sLORETA inverse solution on raw data

Compute sLORETA inverse solution on raw data

Compute MNE-dSPM inverse solution on evoked data in volume source space

Compute MNE-dSPM inverse solution on evoked data in volume source space

Demonstrate impact of whitening on source estimates

Demonstrate impact of whitening on source estimates

Source localization with a custom inverse solver

Source localization with a custom inverse solver

Compute source power using DICS beamformer

Compute source power using DICS beamformer

Compute evoked ERS source power using DICS, LCMV beamformer, and dSPM

Compute evoked ERS source power using DICS, LCMV beamformer, and dSPM

Compute a sparse inverse solution using the Gamma-MAP empirical Bayesian method

Compute a sparse inverse solution using the Gamma-MAP empirical Bayesian method

Extracting time course from source_estimate object

Extracting time course from source_estimate object

Generate a functional label from source estimates

Generate a functional label from source estimates

Extracting the time series of activations in a label

Extracting the time series of activations in a label

Compute sparse inverse solution with mixed norm: MxNE and irMxNE

Compute sparse inverse solution with mixed norm: MxNE and irMxNE

Compute MNE inverse solution on evoked data with a mixed source space

Compute MNE inverse solution on evoked data with a mixed source space

Compute source power estimate by projecting the covariance with MNE

Compute source power estimate by projecting the covariance with MNE

Morph surface source estimate

Morph surface source estimate

Morph volumetric source estimate

Morph volumetric source estimate

Compute iterative reweighted TF-MxNE with multiscale time-frequency dictionary

Compute iterative reweighted TF-MxNE with multiscale time-frequency dictionary

Visualize source leakage among labels using a circular graph

Visualize source leakage among labels using a circular graph

Plot point-spread functions (PSFs) and cross-talk functions (CTFs)

Plot point-spread functions (PSFs) and cross-talk functions (CTFs)

Compute cross-talk functions for LCMV beamformers

Compute cross-talk functions for LCMV beamformers

Compute Rap-Music on evoked data

Compute Rap-Music on evoked data

Reading an inverse operator

Reading an inverse operator

Reading an STC file

Reading an STC file

Compute spatial resolution metrics in source space

Compute spatial resolution metrics in source space

Compute spatial resolution metrics to compare MEG with EEG+MEG

Compute spatial resolution metrics to compare MEG with EEG+MEG

Estimate data SNR using an inverse

Estimate data SNR using an inverse

Computing source space SNR

Computing source space SNR

Time-frequency beamforming using DICS

Time-frequency beamforming using DICS

Compute MxNE with time-frequency sparse prior

Compute MxNE with time-frequency sparse prior

Plotting the full vector-valued MNE solution

Plotting the full vector-valued MNE solution

Examples on open datasets

Some demos on common/public datasets using MNE.

Brainstorm raw (median nerve) dataset

Brainstorm raw (median nerve) dataset

HF-SEF dataset

HF-SEF dataset

Single trial linear regression analysis with the LIMO dataset

Single trial linear regression analysis with the LIMO dataset

Optically pumped magnetometer (OPM) data

Optically pumped magnetometer (OPM) data

From raw data to dSPM on SPM Faces dataset

From raw data to dSPM on SPM Faces dataset

Download all examples in Python source code: auto_examples_python.zip

Download all examples in Jupyter notebooks: auto_examples_jupyter.zip

Gallery generated by Sphinx-Gallery

  • Massachusetts General Hospital
  • Athinoula A. Martinos Center for Biomedical Imaging
  • Harvard Medical School
  • Massachusetts Institute of Technology
  • New York University
  • Commissariat à l´énergie atomique et aux énergies alternatives
  • Aalto-yliopiston perustieteiden korkeakoulu
  • Télécom ParisTech
  • University of Washington
  • Institut du Cerveau et de la Moelle épinière
  • Boston University
  • Institut national de la santé et de la recherche médicale
  • Forschungszentrum Jülich
  • Technische Universität Ilmenau
  • Berkeley Institute for Data Science
  • Institut national de recherche en informatique et en automatique
  • Aarhus Universitet
  • Karl-Franzens-Universität Graz

© Copyright 2012-2021, MNE Developers. Last updated 2021-04-02 17:37 UTC