Note
Click here to download the full example code
Define target events based on time lag, plot evoked response
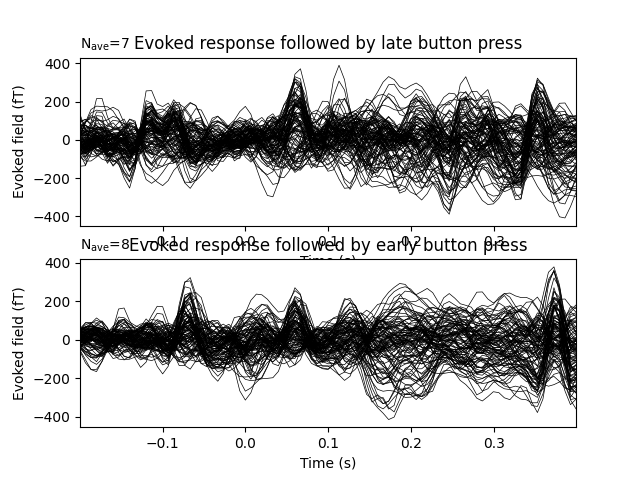
This script shows how to define higher order events based on time lag between reference and target events. For illustration, we will put face stimuli presented into two classes, that is 1) followed by an early button press (within 590 milliseconds) and followed by a late button press (later than 590 milliseconds). Finally, we will visualize the evoked responses to both ‘quickly-processed’ and ‘slowly-processed’ face stimuli.
# Authors: Denis Engemann <denis.engemann@gmail.com>
#
# License: BSD (3-clause)

import mne
from mne import io
from mne.event import define_target_events
from mne.datasets import sample
import matplotlib.pyplot as plt

print(__doc__)

data_path = sample.data_path()
Set parameters
raw_fname = data_path + '/MEG/sample/sample_audvis_filt-0-40_raw.fif'
event_fname = data_path + '/MEG/sample/sample_audvis_filt-0-40_raw-eve.fif'

#   Setup for reading the raw data
raw = io.read_raw_fif(raw_fname)
events = mne.read_events(event_fname)

#   Set up pick list: EEG + STI 014 - bad channels (modify to your needs)
include = []  # or stim channels ['STI 014']
raw.info['bads'] += ['EEG 053']  # bads

# pick MEG channels
picks = mne.pick_types(raw.info, meg='mag', eeg=False, stim=False, eog=True,
                       include=include, exclude='bads')
Out:
Opening raw data file /home/circleci/mne_data/MNE-sample-data/MEG/sample/sample_audvis_filt-0-40_raw.fif...
    Read a total of 4 projection items:
        PCA-v1 (1 x 10²)  idle
        PCA-v2 (1 x 10²)  idle
        PCA-v3 (1 x 10²)  idle
        Average EEG reference (1 x 60)  idle
    Range : 6450 ... 48149 =     42.956 ...   320.665 secs
Ready.
Find stimulus event followed by quick button presses
reference_id = 5  # presentation of a smiley face
target_id = 32  # button press
sfreq = raw.info['sfreq']  # sampling rate
tmin = 0.1  # trials leading to very early responses will be rejected
tmax = 0.59  # ignore face stimuli followed by button press later than 590 ms
new_id = 42  # the new event id for a hit. If None, reference_id is used.
fill_na = 99  # the fill value for misses

events_, lag = define_target_events(events, reference_id, target_id,
                                    sfreq, tmin, tmax, new_id, fill_na)

print(events_)  # The 99 indicates missing or too late button presses

# besides the events also the lag between target and reference is returned
# this could e.g. be used as parametric regressor in subsequent analyses.

print(lag[lag != fill_na])  # lag in milliseconds

# #############################################################################
# Construct epochs

tmin_ = -0.2
tmax_ = 0.4
event_id = dict(early=new_id, late=fill_na)

epochs = mne.Epochs(raw, events_, event_id, tmin_,
                    tmax_, picks=picks, baseline=(None, 0),
                    reject=dict(mag=4e-12))

# average epochs and get an Evoked dataset.

early, late = [epochs[k].average() for k in event_id]
Out:
[[ 8522     0    99]
 [10649     0    42]
 [12859     0    99]
 [14830     0    99]
 [16850     0    99]
 [18826     0    42]
 [21224     0    42]
 [23200     0    42]
 [25272     0    99]
 [27243     0    99]
 [29525     0    42]
 [31530     0    42]
 [33481     0    99]
 [35611     0    99]
 [38007     0    42]]
[         nan 566.08643728          nan          nan          nan
 532.78723509 352.97154325 359.63138369          nan          nan
 446.20930939 579.40611816          nan          nan 512.80771377]
Not setting metadata
Not setting metadata
15 matching events found
Setting baseline interval to [-0.19979521315838786, 0.0] sec
Applying baseline correction (mode: mean)
Created an SSP operator (subspace dimension = 3)
4 projection items activated
Removing projector <Projection | Average EEG reference, active : True, n_channels : 60>
Removing projector <Projection | Average EEG reference, active : True, n_channels : 60>
View evoked response
times = 1e3 * epochs.times  # time in milliseconds
title = 'Evoked response followed by %s button press'

fig, axes = plt.subplots(2, 1)
early.plot(axes=axes[0], time_unit='s')
axes[0].set(title=title % 'late', ylabel='Evoked field (fT)')
late.plot(axes=axes[1], time_unit='s')
axes[1].set(title=title % 'early', ylabel='Evoked field (fT)')
plt.show()

Total running time of the script: ( 0 minutes 4.366 seconds)
Estimated memory usage: 8 MB