Note
Click here to download the full example code
FDR correction on T-test on sensor data
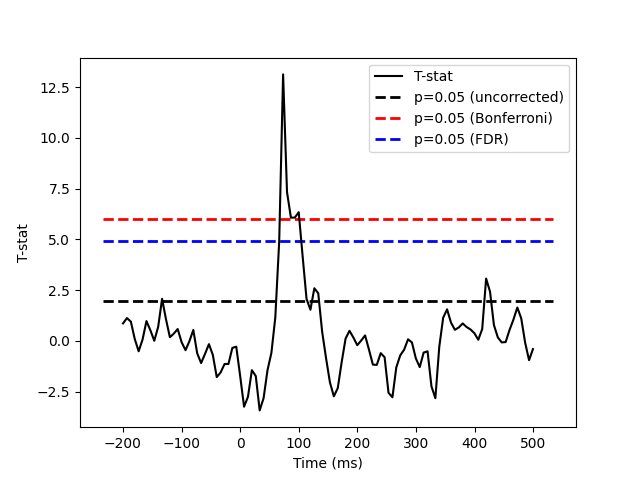
One tests if the evoked response significantly deviates from 0. Multiple comparison problem is addressed with False Discovery Rate (FDR) correction.
# Authors: Alexandre Gramfort <alexandre.gramfort@inria.fr>
#
# License: BSD (3-clause)

import numpy as np
from scipy import stats
import matplotlib.pyplot as plt

import mne
from mne import io
from mne.datasets import sample
from mne.stats import bonferroni_correction, fdr_correction

print(__doc__)
Set parameters
data_path = sample.data_path()
raw_fname = data_path + '/MEG/sample/sample_audvis_filt-0-40_raw.fif'
event_fname = data_path + '/MEG/sample/sample_audvis_filt-0-40_raw-eve.fif'
event_id, tmin, tmax = 1, -0.2, 0.5

#   Setup for reading the raw data
raw = io.read_raw_fif(raw_fname)
events = mne.read_events(event_fname)[:30]

channel = 'MEG 1332'  # include only this channel in analysis
include = [channel]
Out:
Opening raw data file /home/circleci/mne_data/MNE-sample-data/MEG/sample/sample_audvis_filt-0-40_raw.fif...
    Read a total of 4 projection items:
        PCA-v1 (1 x 10²)  idle
        PCA-v2 (1 x 10²)  idle
        PCA-v3 (1 x 10²)  idle
        Average EEG reference (1 x 60)  idle
    Range : 6450 ... 48149 =     42.956 ...   320.665 secs
Ready.
Read epochs for the channel of interest
picks = mne.pick_types(raw.info, meg=False, eog=True, include=include,
                       exclude='bads')
event_id = 1
reject = dict(grad=4000e-13, eog=150e-6)
epochs = mne.Epochs(raw, events, event_id, tmin, tmax, picks=picks,
                    baseline=(None, 0), reject=reject)
X = epochs.get_data()  # as 3D matrix
X = X[:, 0, :]  # take only one channel to get a 2D array
Out:
Not setting metadata
Not setting metadata
7 matching events found
Setting baseline interval to [-0.19979521315838786, 0.0] sec
Applying baseline correction (mode: mean)
4 projection items activated
Loading data for 7 events and 106 original time points ...
0 bad epochs dropped
Compute statistic
T, pval = stats.ttest_1samp(X, 0)
alpha = 0.05

n_samples, n_tests = X.shape
threshold_uncorrected = stats.t.ppf(1.0 - alpha, n_samples - 1)

reject_bonferroni, pval_bonferroni = bonferroni_correction(pval, alpha=alpha)
threshold_bonferroni = stats.t.ppf(1.0 - alpha / n_tests, n_samples - 1)

reject_fdr, pval_fdr = fdr_correction(pval, alpha=alpha, method='indep')
threshold_fdr = np.min(np.abs(T)[reject_fdr])
Plot
times = 1e3 * epochs.times

plt.close('all')
plt.plot(times, T, 'k', label='T-stat')
xmin, xmax = plt.xlim()
plt.hlines(threshold_uncorrected, xmin, xmax, linestyle='--', colors='k',
           label='p=0.05 (uncorrected)', linewidth=2)
plt.hlines(threshold_bonferroni, xmin, xmax, linestyle='--', colors='r',
           label='p=0.05 (Bonferroni)', linewidth=2)
plt.hlines(threshold_fdr, xmin, xmax, linestyle='--', colors='b',
           label='p=0.05 (FDR)', linewidth=2)
plt.legend()
plt.xlabel("Time (ms)")
plt.ylabel("T-stat")
plt.show()
Total running time of the script: ( 0 minutes 6.241 seconds)
Estimated memory usage: 8 MB