mne.viz.plot_dipole_locations
-
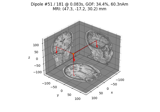
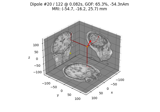
mne.viz.plot_dipole_locations(dipoles, trans=None, subject=None, subjects_dir=None, mode='orthoview', coord_frame='mri', idx='gof', show_all=True, ax=None, block=False, show=True, scale=0.005, color=None, highlight_color='r', fig=None, verbose=None, title=None)[source]¶ Plot dipole locations.
If mode is set to ‘arrow’ or ‘sphere’, only the location of the first time point of each dipole is shown else use the show_all parameter.
The option mode=’orthoview’ was added in version 0.14.
- Parameters
- dipoles
listof instances ofDipole|Dipole The dipoles to plot.
- trans
dict|None The mri to head trans. Can be None with mode set to ‘3d’.
- subject
str|None The subject name corresponding to FreeSurfer environment variable SUBJECT. Can be None with mode set to ‘3d’.
- subjects_dir
None|str The path to the freesurfer subjects reconstructions. It corresponds to Freesurfer environment variable SUBJECTS_DIR. The default is None.
- mode
str Can be
'arrow','sphere'or'orthoview'.New in version 0.19.0.
- coord_frame
str Coordinate frame to use, ‘head’ or ‘mri’. Defaults to ‘mri’.
New in version 0.14.0.
- idx
int| ‘gof’ | ‘amplitude’ Index of the initially plotted dipole. Can also be ‘gof’ to plot the dipole with highest goodness of fit value or ‘amplitude’ to plot the dipole with the highest amplitude. The dipoles can also be browsed through using up/down arrow keys or mouse scroll. Defaults to ‘gof’. Only used if mode equals ‘orthoview’.
New in version 0.14.0.
- show_allbool
Whether to always plot all the dipoles. If
True(default), the active dipole is plotted as a red dot and its location determines the shown MRI slices. The non-active dipoles are plotted as small blue dots. IfFalse, only the active dipole is plotted. Only used ifmode='orthoview'.New in version 0.14.0.
- axinstance of matplotlib
Axes3D|None Axes to plot into. If None (default), axes will be created. Only used if mode equals ‘orthoview’.
New in version 0.14.0.
- blockbool
Whether to halt program execution until the figure is closed. Defaults to False. Only used if mode equals ‘orthoview’.
New in version 0.14.0.
- showbool
Show figure if True. Defaults to True. Only used if mode equals ‘orthoview’.
- scale
float The scale of the dipoles if
modeis ‘arrow’ or ‘sphere’.- color
tuple The color of the dipoles. The default (None) will use
'y'if mode is'orthoview'andshow_allis True, else ‘r’.Changed in version 0.19.0: Color is now passed in orthoview mode.
- highlight_colorcolor
The highlight color. Only used in orthoview mode with
show_all=True.New in version 0.19.0.
- fig
mayavi.mlab.Figure|None 3D Scene in which to plot the alignment. If
None, creates a new 600x600 pixel figure with black background.New in version 0.19.0.
- verbosebool,
str,int, orNone If not None, override default verbose level (see
mne.verbose()and Logging documentation for more). If used, it should be passed as a keyword-argument only.- title
str|None The title of the figure if
mode='orthoview'(ignored for all other modes). IfNone, dipole number and its properties (amplitude, orientation etc.) will be shown. Defaults toNone.New in version 0.21.0.
- dipoles
- Returns
- figinstance of
mayavi.mlab.Figureormatplotlib.figure.Figure The mayavi figure or matplotlib Figure.
- figinstance of
Notes
New in version 0.9.0.