Note
Go to the end to download the full example code.
Reading an STC file#
STC files contain activations on cortex ie. source reconstructions
# Author: Alexandre Gramfort <alexandre.gramfort@inria.fr>
#
# License: BSD-3-Clause
# Copyright the MNE-Python contributors.
import matplotlib.pyplot as plt

import mne
from mne.datasets import sample

print(__doc__)

data_path = sample.data_path()
meg_path = data_path / "MEG" / "sample"
fname = meg_path / "sample_audvis-meg"

stc = mne.read_source_estimate(fname)

n_vertices, n_samples = stc.data.shape
print(f"stc data size: {n_vertices} (nb of vertices) x {n_samples} (nb of samples)")

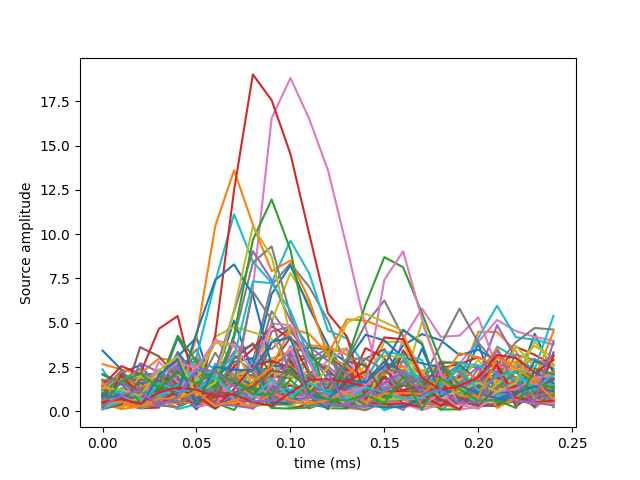
# View source activations
plt.plot(stc.times, stc.data[::100, :].T)
plt.xlabel("time (ms)")
plt.ylabel("Source amplitude")
plt.show()

stc data size: 7498 (nb of vertices) x 25 (nb of samples)
Total running time of the script: (0 minutes 2.565 seconds)
Estimated memory usage: 9 MB