Note
Go to the end to download the full example code.
The Spectrum and EpochsSpectrum classes: frequency-domain data#
This tutorial shows how to create and visualize frequency-domain representations of your
data, starting from continuous Raw, discontinuous Epochs,
or averaged Evoked data.
As usual we’ll start by importing the modules we need, and loading our sample dataset:
import numpy as np

import mne

sample_data_folder = mne.datasets.sample.data_path()
sample_data_raw_file = sample_data_folder / "MEG" / "sample" / "sample_audvis_raw.fif"
raw = mne.io.read_raw_fif(sample_data_raw_file, verbose=False).crop(tmax=60)
All three sensor-space containers (Raw,
Epochs, and Evoked) have a
compute_psd() method with the same options.
Effective window size : 3.410 (s)
By default, the spectral estimation method will be the
Welch[1] method for continuous data, and the multitaper
method [2] for epoched or averaged data. This default can
be overridden by passing method='welch' or method='multitaper' to the
compute_psd() method.
There are many other options available as well; for example we can compute a spectrum from a given span of times, for a chosen frequency range, and for a subset of the available channels:
raw.compute_psd(method="multitaper", tmin=10, tmax=20, fmin=5, fmax=30, picks="eeg")
Using multitaper spectrum estimation with 7 DPSS windows
You can also pass some parameters to the underlying spectral estimation
function, such as the FFT window length and overlap for the Welch method; see
the docstrings of mne.time_frequency.Spectrum (esp. its
method_kw parameter) and the spectral estimation functions
psd_array_welch() and
psd_array_multitaper() for details.
For epoched data, the class of the spectral estimate will be
mne.time_frequency.EpochsSpectrum instead of
mne.time_frequency.Spectrum, but most of the API is the same for the
two classes. For example, both have a
get_data() method with an option to
return the bin frequencies:
with mne.use_log_level("WARNING"):  # hide some irrelevant info messages
    events = mne.find_events(raw, stim_channel="STI 014")
    event_dict = {
        "auditory/left": 1,
        "auditory/right": 2,
        "visual/left": 3,
        "visual/right": 4,
    }
    epochs = mne.Epochs(
        raw, events, tmin=-0.3, tmax=0.7, event_id=event_dict, preload=True
    )
epo_spectrum = epochs.compute_psd()
psds, freqs = epo_spectrum.get_data(return_freqs=True)
print(f"\nPSDs shape: {psds.shape}, freqs shape: {freqs.shape}")
epo_spectrum
    Using multitaper spectrum estimation with 7 DPSS windows

PSDs shape: (77, 364, 301), freqs shape: (301,)
Additionally, both Spectrum and
EpochsSpectrum have __getitem__ methods,
meaning their data can be accessed by square-bracket indexing. For
Spectrum objects (computed from
Raw or Evoked data), the indexing works
similar to a Raw object or a
NumPy array:
evoked = epochs["auditory"].average()
evk_spectrum = evoked.compute_psd()
# the first 3 frequency bins for the first 4 channels:
print(evk_spectrum[:4, :3])
    Using multitaper spectrum estimation with 7 DPSS windows
[[5.61863537e-23 1.13487136e-22 9.88010499e-23]
 [2.89065956e-23 4.24056397e-23 3.91160668e-23]
 [1.56762015e-25 2.65842303e-25 2.39426775e-25]
 [5.38758770e-23 1.03771739e-22 9.98519756e-23]]
In contrast, the EpochsSpectrum has indexing
similar to Epochs objects: you can use string values to select
spectral estimates for specific epochs based on their condition names, and
what you get back is a new instance of
EpochsSpectrum rather than a
NumPy array of the data values. Selection via
hierarchical event descriptors (HEDs) is also possible:
# get both "visual/left" and "visual/right" epochs:
epo_spectrum["visual"]
Visualizing Spectrum objects#
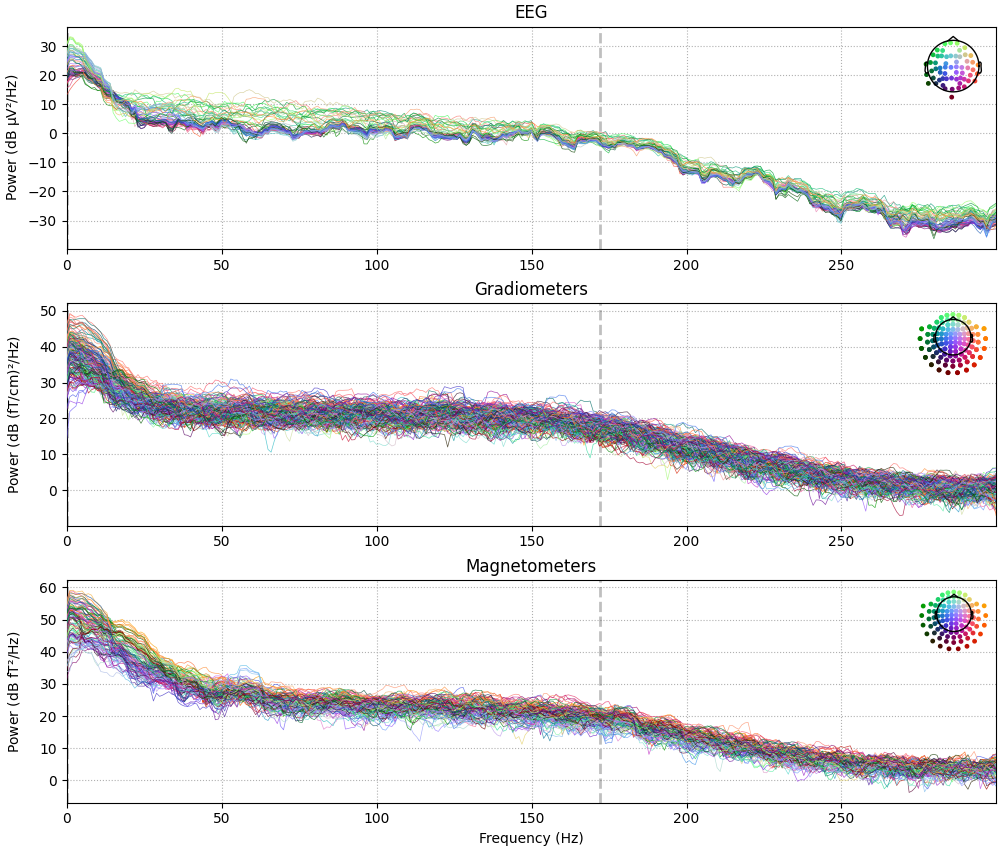
Both Spectrum and
EpochsSpectrum objects have plotting methods
plot() (frequency × power),
plot_topo() (frequency × power separately
for each sensor), and plot_topomap()
(interpolated scalp topography of power, in specific frequency bands). A few
plot options are demonstrated below; see the docstrings for full details.
evk_spectrum.plot(picks="data", exclude="bads", amplitude=False)
evk_spectrum.plot_topo(color="k", fig_facecolor="w", axis_facecolor="w")
Plotting power spectral density (dB=True).
evk_spectrum.plot_topomap(ch_type="eeg", agg_fun=np.median)

Migrating legacy code#
Below is a quick-reference table of equivalent code from before and after the
introduction of the Spectrum and
EpochsSpectrum classes.
Old |
New |
|---|---|
|
|
|
|
|
|
|
|
|
|
Warning
The functions mne.time_frequency.psd_welch and
mne.time_frequency.psd_multitaper have been removed; new code
should use the Raw.compute_psd(),
Epochs.compute_psd(), and
Evoked.compute_psd() methods, and pass
method='welch' or method='multitaper' as a parameter.
The class methods Raw.plot_psd(),
Epochs.plot_psd(),
Raw.plot_psd_topo(), and
Epochs.plot_psd_topomap() have been
kept in the API to support legacy code, but should be avoided when writing
new code.
References#
Total running time of the script: (0 minutes 29.192 seconds)
Estimated memory usage: 649 MB

