mne_connectivity.SpectralConnectivity#
- class mne_connectivity.SpectralConnectivity(data, freqs, n_nodes, names=None, indices='all', method=None, spec_method=None, n_epochs_used=None, **kwargs)[source]#
Spectral connectivity class.
This class stores connectivity data that varies over frequencies. The underlying data is an array of shape
(n_connections, [n_components,] n_freqs), or(n_nodes, n_nodes, [n_components,] n_freqs).n_componentsis an optional dimension for multivariate methods where each connection has multiple components of connectivity.- Parameters:
- data
array, shape ([epochs,] n_estimated_nodes[, components, freqs, times]) The connectivity data that is a raveled array of
(..., n_estimated_nodes, ...)shape. Then_estimated_nodesis equal ton_nodes_in * n_nodes_outif one has computed the full connectivity, or a subset of nodes equal to the length of the arrays inindicespassed in.- freqs
list|array The frequencies at which the connectivity data is computed over. If the frequencies are “frequency bands” (i.e. gamma band), then these are the median of those bands.
- n_nodes
int The number of nodes in the dataset used to compute connectivity. This should be equal to the number of signals in the original dataset.
- namesarray_like |
None The names of the nodes of the dataset used to compute connectivity. If
None(default), then names will be a list of integers from 0 ton_nodes. If a list of names, then it must be equal in length ton_nodes.- indices
tupleof array_like |'all'|'symmetric'|None The indices of relevant connectivity data. If
'all'(default), then data is connectivity between all nodes. If'symmetric', then data is symmetric connectivity between all nodes. If a tuple, then contains two array-likes where the first array represents the “in nodes” (seeds), and the second array represents the “out nodes” (targets).- method
str|None The method name used to compute connectivity (default
None).- spec_method
str|None The type of method used to compute spectral analysis (default
None).- n_epochs_used
int|None The number of epochs used in the computation of connectivity (default
None).- **kwargs
dict Extra connectivity parameters. These may include
freqsfor spectral connectivity,timesfor connectivity over time, orcomponentsfor multivariate connectivity with multiple components per connection. In addition, these may include extra parameters that are stored as xarrayattrs.
- data
- Attributes:
attrsXarray attributes of connectivity.
companionGenerate block companion matrix.
coordsThe coordinates of the xarray data.
dimsThe dimensions of the xarray data.
freqsThe frequency points of the connectivity data.
indicesIndices of connectivity data.
methodThe method used to compute connectivity.
n_epochsThe number of epochs the connectivity data varies over.
n_epochs_usedNumber of epochs used in computation of connectivity.
n_nodesThe number of nodes in the original dataset.
namesNode names.
shapeShape of raveled connectivity.
xarrayXarray of the connectivity data.
Methods
append(epoch_conn)Append another connectivity structure.
combine([combine])Combine connectivity data over epochs.
get_data([output])Get connectivity data as a numpy array.
plot_circle(**kwargs)Visualize connectivity as a circular graph.
predict(data)Predict samples on actual data.
rename_nodes(mapping)Rename nodes.
save(fname)Save connectivity data to disk.
simulate(n_samples[, noise_func, random_state])Simulate vector autoregressive (VAR) model.
copy
eigvals
get_epoch_annotations
is_stable
See also
- append(epoch_conn)#
Append another connectivity structure.
- Parameters:
- epoch_conninstance of
Connectivity The epoched Connectivity class to append.
- epoch_conninstance of
- Returns:
- selfinstance of
Connectivity The altered epoched Connectivity class.
- selfinstance of
- property attrs#
Xarray attributes of connectivity.
See
xarray’sattrs.
- combine(combine='mean')#
Combine connectivity data over epochs.
- Parameters:
- combine
'mean'|'median'|callable() How to combine correlation estimates across epochs. Default is
'mean'. If callable, it must accept one positional input. For example:combine = lambda data: np.median(data, axis=0)
- combine
- Returns:
- conninstance of
Connectivity The combined connectivity data structure. Instance type reflects that of the input instance, without the epoch dimension.
- conninstance of
- property companion#
Generate block companion matrix.
Returns the data matrix if the model is VAR(1).
- property coords#
The coordinates of the xarray data.
- property dims#
The dimensions of the xarray data.
- property freqs#
The frequency points of the connectivity data.
If these are computed over a frequency band, it will be the median frequency of the frequency band.
- get_data(output='compact')#
Get connectivity data as a numpy array.
- Parameters:
- output
'compact'|'raveled'|'dense' How to format the output:
'raveled'will represent each connectivity matrix as a(..., n_nodes_in * n_nodes_out, ...)array'dense'will return each connectivity matrix as a(..., n_nodes_in, n_nodes_out, ...)array'compact'(default) will return'raveled'ifindiceswere defined as a tuple of arrays, or'dense'ifindices='all'
Multivariate connectivity data cannot be returned in a dense form.
- output
- Returns:
- data
array The output connectivity data.
- data
- property indices#
Indices of connectivity data.
- property method#
The method used to compute connectivity.
- property n_epochs#
The number of epochs the connectivity data varies over.
- property n_epochs_used#
Number of epochs used in computation of connectivity.
Can be
None, if there was no epochs used. This is equivalent to the number of epochs, if there is no combining of epochs.
- property n_nodes#
The number of nodes in the original dataset.
Even if
indicesdefines a subset of nodes that were computed, this should be the total number of nodes in the original dataset.
- property names#
Node names.
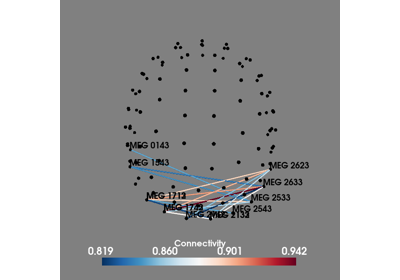
- plot_circle(**kwargs)#
Visualize connectivity as a circular graph.
- Parameters:
- node_names
listofstr Node names. The order corresponds to the order in
con.- indices
tupleof array_like |None Two arrays with indices of connections for which the connections strengths are defined in
con. Only needed ifconis a 1D array.- n_lines
int|None If not
None, only then_linesstrongest connections (strength=abs(con)) are drawn.- node_angles
array, shape (n_node_names,) |None Array with node positions in degrees. If
None, the nodes are equally spaced on the circle. Seemne.viz.circular_layout().- node_width
float|None Width of each node in degrees. If
None, the minimum angle between any two nodes is used as the width.- node_height
float The relative height of the colored bar labeling each node. Default 1.0 is the standard height.
- node_colors
listoftuple|listofstr List with the color to use for each node. If fewer colors than nodes are provided, the colors will be repeated. Any color supported by matplotlib can be used, e.g., RGBA tuples, named colors.
- facecolor
str Color to use for background. See
matplotlib.colors.- textcolor
str Color to use for text. See
matplotlib.colors.- node_edgecolor
str Color to use for lines around nodes. See
matplotlib.colors.- linewidth
float Line width to use for connections.
- colormap
str| instance ofmatplotlib.colors.LinearSegmentedColormap Colormap to use for coloring the connections.
- vmin
float|None Minimum value for colormap. If
None, it is determined automatically.- vmax
float|None Maximum value for colormap. If
None, it is determined automatically.- colorbarbool
Display a colorbar or not.
- title
str The figure title.
- colorbar_size
float Size of the colorbar.
- colorbar_pos
tuple, shape (2,) Position of the colorbar.
- fontsize_title
int Font size to use for title.
- fontsize_names
int Font size to use for node names.
- fontsize_colorbar
int Font size to use for colorbar.
- padding
float Space to add around figure to accommodate long labels.
- axinstance of
matplotlib.projections.polar.PolarAxes|None The axes to use to plot the connectivity circle.
- interactivebool
When enabled, left-click on a node to show only connections to that node. Right-click shows all connections.
- node_linewidth
float Line width for nodes.
- showbool
Show figure if
True.
- node_names
- Returns:
- figinstance of
matplotlib.figure.Figure The figure handle.
- axinstance of
matplotlib.projections.polar.PolarAxes The subplot handle.
- figinstance of
Notes
This code is based on a circle graph example by Nicolas P. Rougier.
By default,
matplotlib.pyplot.savefig()does not takefacecolorinto account when saving, even if set when a figure is generated. This can be addressed via, e.g.:>>> fig.savefig(fname_fig, facecolor='black')
If
facecoloris not set viamatplotlib.pyplot.savefig(), the figure labels, title, and legend may be cut off in the output figure.
- predict(data)#
Predict samples on actual data.
The result of this function is used for calculating the residuals.
- Parameters:
- data
array, shape ([n_epochs,] n_signals, n_times) Epoched or continuous data set.
- data
- Returns:
- predicted
array, shape ([n_epochs,] n_signals, n_times) Data as predicted by the VAR model of shape same as
data.
- predicted
Notes
Residuals are obtained by
r = x - var.predict(x).To compute residual covariances:
# compute the covariance of the residuals
# row are observations, columns are variables
t = residuals.shape[0]
sampled_residuals = np.concatenate(
    np.split(residuals[:, :, lags:], t, 0), axis=2
).squeeze(0)
rescov = np.cov(sampled_residuals)
- rename_nodes(mapping)#
Rename nodes.
- Parameters:
- mapping
dict Mapping from original node names (keys) to new node names (values).
- mapping
- save(fname)#
Save connectivity data to disk.
Can later be loaded using the function
read_connectivity().- Parameters:
- fname
str|pathlib.Path The filepath to save the data. Data is saved as netCDF files (
.ncextension).
- fname
- property shape#
Shape of raveled connectivity.
- simulate(n_samples, noise_func=None, random_state=None)#
Simulate vector autoregressive (VAR) model.
This function generates data from the VAR model.
- Parameters:
- n_samples
int Number of samples to generate.
- noise_func
callable()|None This function is used to create the generating noise process. If
None, Gaussian white noise with zero mean and unit variance is used.- random_state
None|int| instance ofRandomState If
random_stateis an int, it will be used as a seed fornumpy.random.RandomState. IfNone, the seed will be obtained from the operating system (seenumpy.random.RandomStatefor details). Default isNone.
- n_samples
- Returns:
- data
array, shape (n_samples, n_channels) Generated data.
- data
- property xarray#
Xarray of the connectivity data.
Examples using mne_connectivity.SpectralConnectivity#
Multivariate decomposition for efficient connectivity analysis
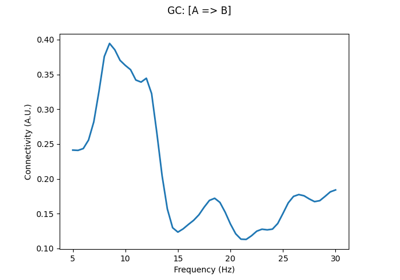
Compute directionality of connectivity with multivariate Granger causality
Working with ragged indices for multivariate connectivity
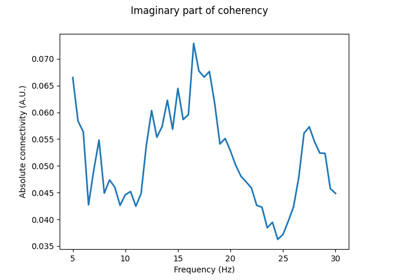
Compute multivariate measures of the imaginary part of coherency
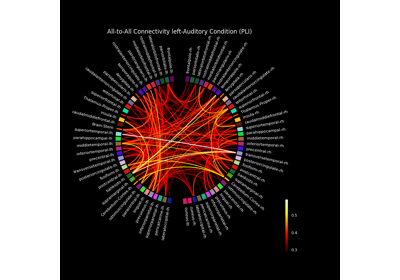
Compute mixed source space connectivity and visualize it using a circular graph
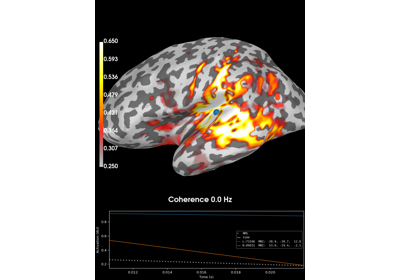
Compute coherence in source space using a MNE inverse solution
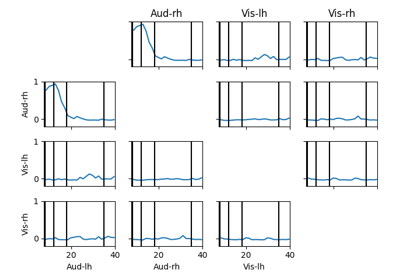
Compute full spectrum source space connectivity between labels
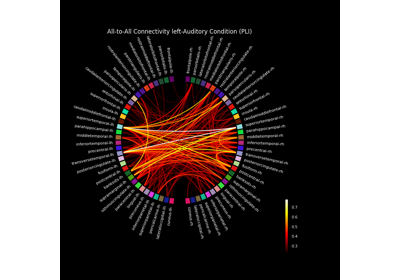
Compute source space connectivity and visualize it using a circular graph
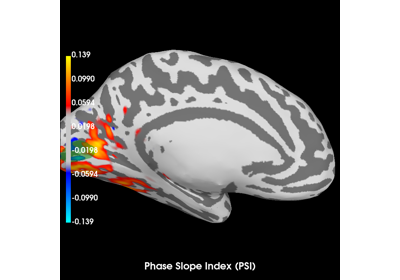
Compute Phase Slope Index (PSI) in source space for a visual stimulus
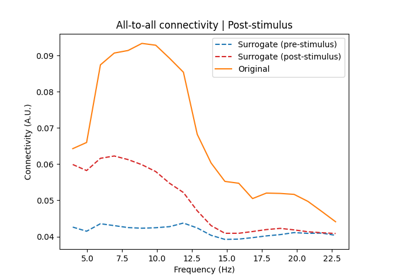
Determine the significance of connectivity estimates against baseline connectivity