mne_connectivity.phase_slope_index#
- mne_connectivity.phase_slope_index(data, names=None, indices=None, sfreq='', mode='multitaper', fmin=None, fmax=inf, tmin=None, tmax=None, mt_bandwidth=None, mt_adaptive=False, mt_low_bias=True, cwt_freqs=None, cwt_n_cycles=7, block_size=1000, n_jobs=1, verbose=None)[source]#
Compute the Phase Slope Index (PSI) connectivity measure.
The PSI is an effective connectivity measure, i.e., a measure which can give an indication of the direction of the information flow (causality). For two time series, and one computes the PSI between the first and the second time series as follows:
indices = (np.array([0]), np.array([1]))
psi = phase_slope_index(data, indices=indices, ...)
A positive value means that time series 0 is ahead of time series 1 and a negative value means the opposite.
The PSI is computed from the coherency (see
spectral_connectivity_epochs()), details can be found in [1].- Parameters:
- dataarray_like, shape (n_epochs, n_signals, n_times) |
Epochs| generator Can also be a list/generator of arrays, shape
(n_signals, n_times); list/generator ofmne.SourceEstimate; ormne.Epochs. The data from which to compute connectivity. Note that it is also possible to combine multiple signals by providing a list of tuples, e.g.,data = [(arr_0, stc_0), (arr_1, stc_1), (arr_2, stc_2)], corresponds to 3 epochs, andarr_*could be an array with the same number of time points asstc_*.- namesarray_like |
None The names of the nodes of the dataset used to compute connectivity. If
None(default), then names will be a list of integers from 0 ton_nodes. If a list of names, then it must be equal in length ton_nodes.- indices
tupleof array_like |None Two array-likes with indices of connections for which to compute connectivity. If
None, all connections are computed. See Notes ofspectral_connectivity_epochs()for details.- sfreq
float|None The sampling frequency. Default is an empty string for
2*np.piin 0.8, but will change toNonein 0.9. Set it explicitly whendatais an array-like to avoid a warning.- mode
'multitaper'|'fourier'|'cwt_morlet' Spectrum estimation mode.
- fmin
float|tupleoffloat The lower frequency of interest. Multiple bands are defined using a tuple, e.g., (8., 20.) for two bands with 8 Hz and 20 Hz lower freq. If
Nonethe frequency corresponding to an epoch length of 5 cycles is used.- fmax
float|tupleoffloat The upper frequency of interest. Multiple bands are defined using a tuple, e.g., (13., 30.) for two bands with 13 Hz and 30 Hz upper freq.
- tmin
float|None Time to start connectivity estimation.
- tmax
float|None Time to end connectivity estimation.
- mt_bandwidth
float|None The bandwidth of the multitaper windowing function in Hz. Only used in
'multitaper'mode.- mt_adaptivebool
Use adaptive weights to combine the tapered spectra into PSD. Only used in
'multitaper'mode.- mt_low_biasbool
Only use tapers with more than 90 percent spectral concentration within bandwidth. Only used in
'multitaper'mode.- cwt_freqsarray_like
Array-like of frequencies of interest. Only used in
'cwt_morlet'mode.- cwt_n_cycles
float| array_like Number of cycles. Fixed number or one per frequency. Only used in
'cwt_morlet'mode.- block_size
int How many connections to compute at once (higher numbers are faster but require more memory).
- n_jobs
int How many epochs to process in parallel.
- verbosebool |
str|int|None If not
None, override default verbose level (seemne.verbose()for more info). If used, it should be passed as a keyword-argument only.
- dataarray_like, shape (n_epochs, n_signals, n_times) |
- Returns:
- conninstance of
SpectralConnectivityorSpectroTemporalConnectivity Computed connectivity measure(s). Either a
SpectralConnectivity, orSpectroTemporalConnectivitycontainer. The shape of each array is:(n_cons, n_bands)for'multitaper'or'fourier'modes(n_cons, n_bands, n_times)for'cwt_morlet'moden_cons = n_signals ** 2whenindices=Nonen_cons = len(indices[0])whenindicesis supplied
- conninstance of
References
Examples using mne_connectivity.phase_slope_index#

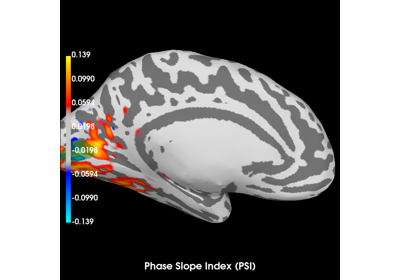
Compute Phase Slope Index (PSI) in source space for a visual stimulus
