mne.channels.Layout#
- class mne.channels.Layout(box, pos, names, ids, kind)[source]#
Sensor layouts.
Layouts are typically loaded from a file using
read_layout(). Only use this class directly if you’re constructing a new layout.- Parameters
Methods
plot([picks, show_axes, show])Plot the sensor positions.
save(fname[, overwrite])Save Layout to disk.
- plot(picks=None, show_axes=False, show=True)[source]#
Plot the sensor positions.
- Parameters
- picks
list|slice|None Channels to include. Slices and lists of integers will be interpreted as channel indices. None (default) will pick all channels. Note that channels in
info['bads']will be included if their indices are explicitly provided.- show_axes
bool Show layout axes if True. Defaults to False.
- show
bool Show figure if True. Defaults to True.
- picks
- Returns
- figinstance of
matplotlib.figure.Figure Figure containing the sensor topography.
- figinstance of
Notes
New in v0.12.0.
Examples using
plot:
Examples using mne.channels.Layout#

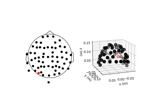
How to convert 3D electrode positions to a 2D image
How to convert 3D electrode positions to a 2D image