Note
Go to the end to download the full example code.
Real-time peak detection🔗
With a StreamLSL, we can build a real-time peak detector. The
structure defined below will be adapted for cardiac R-peak detection, but remains
valid for other peak detector. Note however that the peak detection performance, i.e.
how fast it will be able to detect a peak, will depend heavily on the peak shape.
For this example, consider a StreamLSL connected to an
amplifier stream containing an ECG bipolar channel. We can detect in real-time the
R-peak within the ECG signal. The objective of this example is to create a Detector
object able to detect new R-peak entering the buffer as fast as possible, with some
robustness to external noise sources (e.g. movements) and a simple design.
First let’s have a look to a sample ECG signal and to how we could detect the R-peak
reliably with scipy.signal.find_peaks().
import numpy as np
from matplotlib import pyplot as plt
from mne.io import read_raw_fif
from mne.viz import set_browser_backend
from scipy.signal import find_peaks

from mne_lsl.datasets import sample

raw = read_raw_fif(sample.data_path() / "sample-ecg-raw.fif", preload=True)
raw
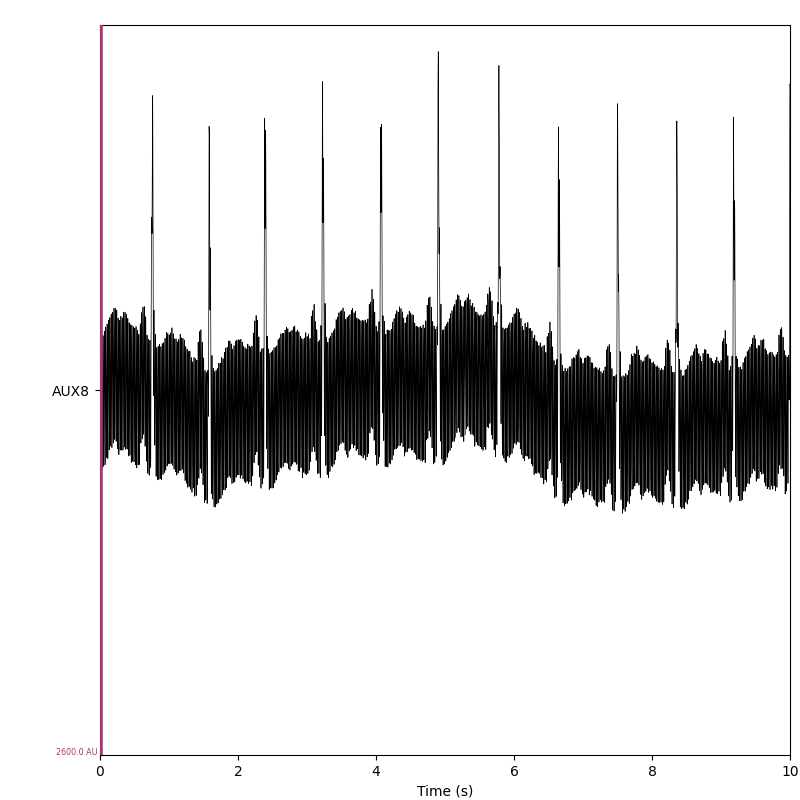
This sample recording contains a single channel with the ECG signal.
set_browser_backend("matplotlib")
raw.plot(scalings=dict(misc=1300), show_scrollbars=False)
plt.show()
Filters🔗
This recording is heavily affected by line noise (50 Hz in Europe). Our detector should filter the signal to distinguish easily the QRS complex and the associated R-peaks. Let’s compare the raw signal with filtered signal using the following settings:
notch at 50 and 100 Hz
bandpass filter between 0.1 and 15 Hz
lowpass filter at 15 Hz
raw_notched = raw.copy()
_ = raw_notched.notch_filter(50, method="iir", phase="forward", picks="misc")
_ = raw_notched.notch_filter(100, method="iir", phase="forward", picks="misc")

raw_bandpassed = raw.copy()
_ = raw_bandpassed.filter(0.1, 15, method="iir", phase="forward", picks="misc")

raw_lowpassed = raw.copy()
_ = raw_lowpassed.filter(None, 15, method="iir", phase="forward", picks="misc")
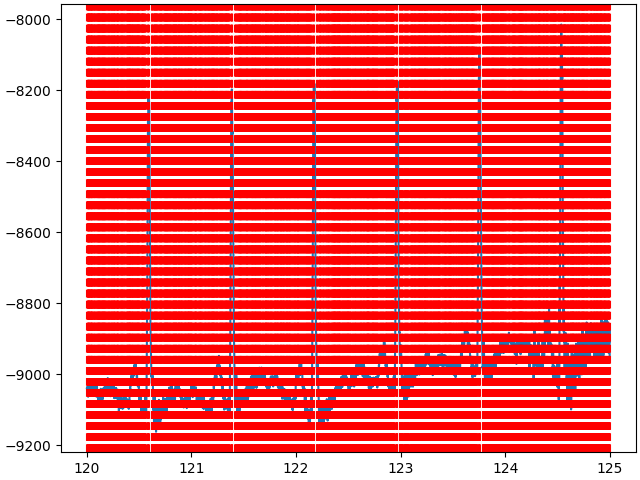
To compare those signals, it would be best if we could overlay them in a single plot. Let’s select a 5 seconds window and plot the detrended signals.
Note
Contrary to the filter used by a StreamLSL, the forward
filter in MNE don’t use initial filter conditions. Thus, the beginning of the
filter signal should not be used as the filter has not yet converged.
start = int(120 * raw.info["sfreq"])
stop = int(125 * raw.info["sfreq"])
fig, ax = plt.subplots(1, 1, figsize=(10, 5), layout="constrained")
for raw_, label in zip(
    (raw, raw_notched, raw_bandpassed, raw_lowpassed),
    ("raw", "notched", "bandpassed", "lowpassed"),
    strict=True,
):
    data, times = raw_[:, start:stop]  # select 5 seconds
    data -= data.mean()  # detrend
    ax.plot(times, data.squeeze(), label=label)
ax.legend()
plt.show()
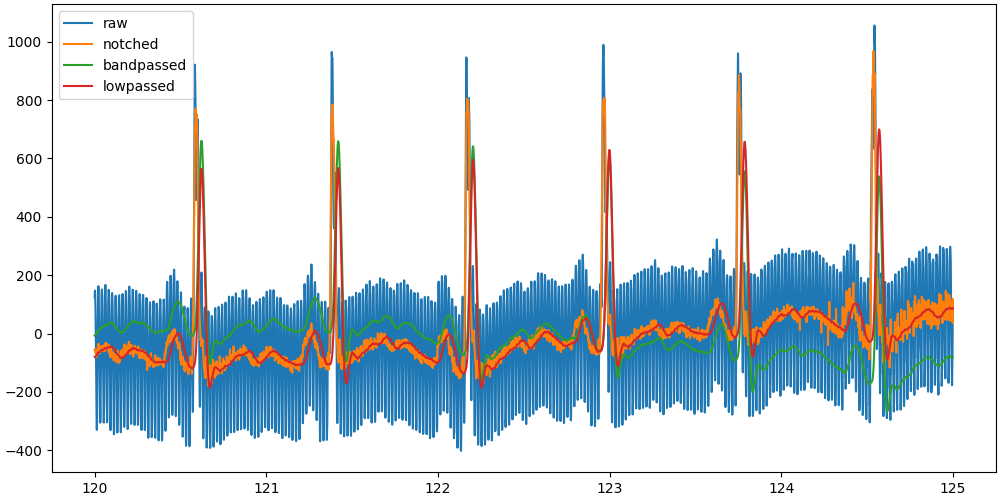
Our first issue arises, the filter is altering the phase of the signal and thus the shape of the QRS complex, shifting the R-peak to the right.
start = int(121.2 * raw.info["sfreq"])
stop = int(121.6 * raw.info["sfreq"])
fig, ax = plt.subplots(1, 1, figsize=(10, 5), layout="constrained")
for raw_, label in zip(
    (raw, raw_notched, raw_bandpassed, raw_lowpassed),
    ("raw", "notched", "bandpassed", "lowpassed"),
    strict=True,
):
    data, times = raw_[:, start:stop]  # select 5 seconds
    data -= data.mean()  # detrend
    ax.plot(times, data.squeeze(), label=label)
ax.legend()
plt.show()
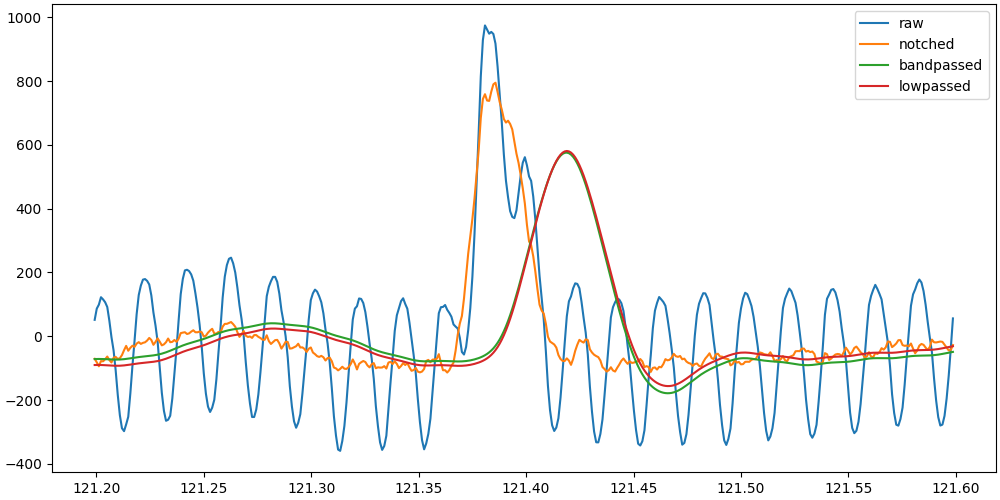
The lowpassed and bandpassed signals are heavily shifted, while the notched signal retains the correct timing of the R-peak. Since our objective is to detect the R-peak as soon as possible, it would be best to use the notched signal which has the highest fidelity with the raw signal shape, while removing a large part of the background noise.
Peak detection🔗
Next, let’s detect the R-peaks on the same 5 seconds window of the notched signal with
scipy.signal.find_peaks().
Note
We do not need to detrend to find peaks. Detrending was only useful to overlay the bandpassed signal with the raw, notched and lowpassed signals.
start = int(120 * raw.info["sfreq"])
stop = int(125 * raw.info["sfreq"])
data, times = raw_notched[:, start:stop]
peaks = find_peaks(data.squeeze())[0]
fig, ax = plt.subplots(1, 1, layout="constrained")
ax.plot(times, data.squeeze())
for peak in peaks:
    ax.axvline(times[peak], color="red", linestyle="--")
plt.show()
The detected peaks are represented by the red dashed lines, and for now, the detection is horrible. But we can improve it by setting the following constraints:
height of the peak should be at least 98% of the data range
distance between two peaks should be at least 0.5 seconds
start = int(120 * raw.info["sfreq"])
stop = int(125 * raw.info["sfreq"])
data, times = raw_notched[:, start:stop]
peaks = find_peaks(
    data.squeeze(),
    height=np.percentile(data.squeeze(), 98),
    distance=0.5 * raw_notched.info["sfreq"],
)[0]
fig, ax = plt.subplots(1, 1, layout="constrained")
ax.plot(times, data.squeeze())
for peak in peaks:
    ax.axvline(times[peak], color="red", linestyle="--")
plt.show()
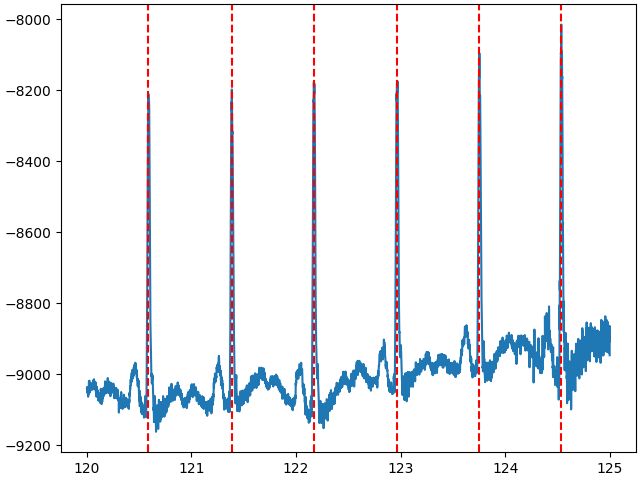
Adjusting the peak detection constraints to your signal is crucial.
Detector🔗
Now that we have a good idea of how to detect the R-peaks, let’s create a real-time
Detector object that will detect the R-peaks as soon as they enter the buffer.
from time import sleep

import numpy as np
from numpy.typing import NDArray
from scipy.signal import find_peaks

from mne_lsl.stream import StreamLSL

ECG_HEIGHT: float = 98.0  # percentile height constraint, in %
ECG_DISTANCE: float = 0.5  # distance constraint, in seconds


class Detector:
    """Real-time single channel peak detector.

    Parameters
    ----------
    bufsize : float
        Size of the buffer in seconds. The buffer will be filled on instantiation, thus
        the program will hold during this duration.
    stream_name : str
        Name of the LSL stream to use for the respiration or cardiac detection. The
        stream should contain a respiration channel using a respiration belt or a
        thermistor and/or an ECG channel.
    stream_source_id : str | None
        A unique identifier of the device or source of the data. If not empty, this
        information improves the system robustness since it allows recipients to recover
        from failure by finding a stream with the same source_id on the network.
    ch_name : str
        Name of the ECG channel in the LSL stream. This channel should contain the ECG
        signal recorded with 2 bipolar electrodes.

    """

    def __init__(
        self,
        bufsize: float,
        stream_name: str,
        stream_source_id: str | None,
        ch_name: str,
    ) -> None:
        # create stream
        self._stream = StreamLSL(
            bufsize, name=stream_name, source_id=stream_source_id
        ).connect(acquisition_delay=None, processing_flags="all")
        self._stream.pick(ch_name)
        self._stream.set_channel_types({ch_name: "misc"}, on_unit_change="ignore")
        self._stream.notch_filter(50, picks=ch_name)
        self._stream.notch_filter(100, picks=ch_name)
        sleep(bufsize)  # prefill an entire buffer

    def detect_peaks(self) -> NDArray[np.float64]:
        """Detect all peaks in the buffer.

        Returns
        -------
        peaks : array of shape (n_peaks,)
            The timestamps of all detected peaks.
        """
        self._stream.acquire()
        data, ts = self._stream.get_data()  # we have a single channel in the stream
        data = data.squeeze()
        peaks, _ = find_peaks(
            data,
            distance=ECG_DISTANCE * self._stream.info["sfreq"],
            height=np.percentile(data, ECG_HEIGHT),
        )
        return ts[peaks]
The object above is a good start, but it will detect all peaks in the buffer and it doesn’t have any memory of which peak was already detected. We need to add some triage logic on the detected peaks and a memory of the last detected peak(s).
The triage logic will:
detect all peaks in the current buffer
create a list of peak candidates which correspond to detected peaks which have not yet been selected as ‘latest peak’
count the number of times each peak candidate is detected
if a peak candidate is detected 4 times, the most recent peak candidate becomes the latest peak and is returned (i.e. detected)
The triage logic uses a memory of the last detected peaks to count the number of peak candidates between 2 iteration, and to store the last known detected peak. This is simplify achieved by storing the LSL time at which the peak was detected.
from time import sleep

import numpy as np
from numpy.typing import NDArray
from scipy.signal import find_peaks

from mne_lsl.stream import StreamLSL

ECG_HEIGHT: float = 98.0  # percentile height constraint, in %
ECG_DISTANCE: float = 0.5  # distance constraint, in seconds


class Detector:
    """Real-time single channel peak detector.

    Parameters
    ----------
    bufsize : float
        Size of the buffer in seconds. The buffer will be filled on instantiation, thus
        the program will hold during this duration.
    stream_name : str
        Name of the LSL stream to use for the respiration or cardiac detection. The
        stream should contain a respiration channel using a respiration belt or a
        thermistor and/or an ECG channel.
    stream_source_id : str | None
        A unique identifier of the device or source of the data. If not empty, this
        information improves the system robustness since it allows recipients to recover
        from failure by finding a stream with the same source_id on the network.
    ch_name : str
        Name of the ECG channel in the LSL stream. This channel should contain the ECG
        signal recorded with 2 bipolar electrodes.
    """

    def __init__(
        self,
        bufsize: float,
        stream_name: str,
        stream_source_id: str | None,
        ch_name: str,
    ) -> None:
        # create stream
        self._stream = StreamLSL(
            bufsize, name=stream_name, source_id=stream_source_id
        ).connect(acquisition_delay=None, processing_flags="all")
        self._stream.pick(ch_name)
        self._stream.set_channel_types({ch_name: "misc"}, on_unit_change="ignore")
        self._stream.notch_filter(50, picks=ch_name)
        self._stream.notch_filter(100, picks=ch_name)
        sleep(bufsize)  # prefill an entire buffer
        # peak detection settings
        self._last_peak = None
        self._peak_candidates = None
        self._peak_candidates_count = None

    def detect_peaks(self) -> NDArray[np.float64]:
        """Detect all peaks in the buffer.

        Returns
        -------
        peaks : array of shape (n_peaks,)
            The timestamps of all detected peaks.
        """
        self._stream.acquire()
        if self._stream.n_new_samples == 0:
            return np.array([])  # nothing new to do
        data, ts = self._stream.get_data()  # we have a single channel in the stream
        data = data.squeeze()
        peaks, _ = find_peaks(
            data,
            distance=ECG_DISTANCE * self._stream.info["sfreq"],
            height=np.percentile(data, ECG_HEIGHT),
        )
        return ts[peaks]

    def new_peak(self) -> float | None:
        """Detect new peak entering the buffer.

        Returns
        -------
        peak : float | None
            The timestamp of the newly detected peak. None if no new peak is detected.
        """
        ts_peaks = self.detect_peaks()
        if ts_peaks.size == 0:
            return None
        if self._peak_candidates is None and self._peak_candidates_count is None:
            self._peak_candidates = list(ts_peaks)
            self._peak_candidates_count = [1] * ts_peaks.size
            return None
        peaks2append = []
        for k, peak in enumerate(self._peak_candidates):
            if peak in ts_peaks:
                self._peak_candidates_count[k] += 1
            else:
                peaks2append.append(peak)
        # before going further, let's make sure we don't add too many false positives,
        # which could be indicative of noise in the signal (e.g. movements)
        if int(self._stream._bufsize * (1 / ECG_DISTANCE)) < len(peaks2append) + len(
            self._peak_candidates
        ):
            self._peak_candidates = None
            self._peak_candidates_count = None
            return None
        self._peak_candidates.extend(peaks2append)
        self._peak_candidates_count.extend([1] * len(peaks2append))
        # now, all the detected peaks have been triage, let's see if we have a winner
        idx = [k for k, count in enumerate(self._peak_candidates_count) if 4 <= count]
        if len(idx) == 0:
            return None
        peaks = sorted([self._peak_candidates[k] for k in idx])
        # compare the winner with the last known peak
        if self._last_peak is None:  # don't return the first peak detected
            new_peak = None
            self._last_peak = peaks[-1]
        if self._last_peak is None or self._last_peak + ECG_DISTANCE <= peaks[-1]:
            new_peak = peaks[-1]
            self._last_peak = peaks[-1]
        else:
            new_peak = None
        # reset the peak candidates
        self._peak_candidates = None
        self._peak_candidates_count = None
        return new_peak

    @property
    def stream(self):
        """Stream object."""
        return self._stream
Performance🔗
Let’s now test this detector and measure the time it takes to detect a new peak entering the buffer. To properly do so, the player should be started in a separate process to avoid hogging the CPU time in the main thread leaving no time for the player to stream new data.
import multiprocessing as mp
import uuid


def player_process(fname, name, source_id, status):
    """Process which runs the process."""
    from mne_lsl.player import PlayerLSL

    player = PlayerLSL(fname, chunk_size=1, name=name, source_id=source_id)
    player.start()
    status.value = 1
    while status.value:
        pass
    player.stop()


fname = sample.data_path() / "sample-ecg-raw.fif"
name = "ecg-example"
source_id = uuid.uuid4().hex
manager = mp.Manager()
status = manager.Value("i", 0)
process = mp.Process(target=player_process, args=(fname, name, source_id, status))
process.start()
while status.value != 1:
    pass  # wait for the player to actually start
Now that a PlayerLSL is running in a separate process, we can
start the detector and measure the time it takes to detect a new peak.
from mne_lsl.lsl import local_clock

detector = Detector(4, name, source_id, "AUX8")
delays = list()
while len(delays) <= 30:
    peak = detector.new_peak()
    if peak is not None:
        delays.append((local_clock() - peak) * 1e3)
detector.stream.disconnect()
status.value = 0  # stops the player

f, ax = plt.subplots(1, 1, layout="constrained")
ax.set_title("Detection delay in ms")
ax.hist(delays, bins=15)
plt.show()
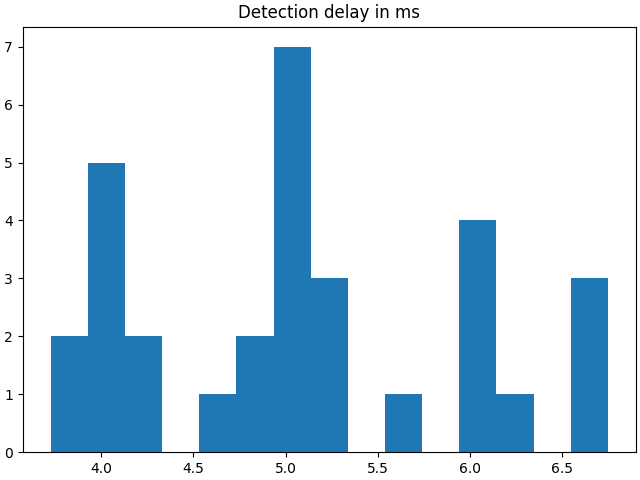
The detection delay displayed can be as low as 1 or 2 ms depending on the computer, on
the process configuration and on the performance of the streaming source. A
PlayerLSL is not reproducing exactly the performance of a
real-time application.
Total running time of the script: (0 minutes 37.822 seconds)
Estimated memory usage: 205 MB