Note
Go to the end to download the full example code.
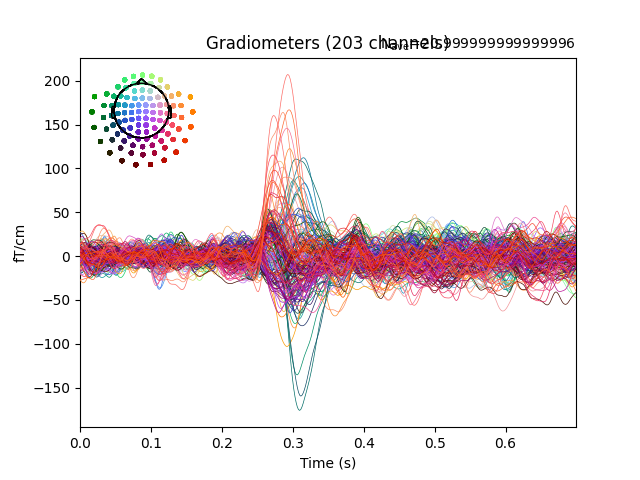
Real-time evoked responses🔗
With a EpochsStream, we can build a real-time evoked response
visualization. This is useful to monitor the brain activity in real-time.
import uuid

import numpy as np
from matplotlib import pyplot as plt
from mne import EvokedArray, combine_evoked
from mne.io import read_raw_fif

from mne_lsl.datasets import sample
from mne_lsl.player import PlayerLSL
from mne_lsl.stream import EpochsStream, StreamLSL
from mne_lsl.utils.logs import logger

# dataset used in the example
fname = sample.data_path() / "mne-sample" / "sample_audvis_raw.fif"
raw = read_raw_fif(fname, preload=False).pick(("meg", "stim")).load_data()
First, we create a mock stream with mne_lsl.player.PlayerLSL from the sample
dataset and connect a StreamLSL to it. Then, we attach a
EpochsStream object to create epochs from the LSL stream.
The epochs will be created around the event ID 1 from the 'STI 014' channel.
Note
A chunk_size of 200 samples is used here to ensure stability and reliability
while building the documentation on the CI. In practice, a chunk_size of 200
samples is too large to represent a real-time application.
source_id = uuid.uuid4().hex
with PlayerLSL(
    raw, chunk_size=200, name="real-time-evoked-example", source_id=source_id
):
    stream = StreamLSL(bufsize=4, name="real-time-evoked-example", source_id=source_id)
    stream.connect(acquisition_delay=0.1, processing_flags="all")
    stream.info["bads"] = ["MEG 2443"]
    stream.filter(None, 40, picks="grad")
    epochs = EpochsStream(
        stream,
        bufsize=20,
        event_id=1,
        event_channels="STI 014",
        tmin=-0.2,
        tmax=0.5,
        baseline=(None, 0),
        picks="grad",
    )
    epochs.connect(acquisition_delay=0.1)

    # create figure
    if not plt.isinteractive():
        plt.ion()
    fig, ax = plt.subplots()
    plt.show()

    # start looking for epochs
    n = 0  # number of epochs
    evoked = None
    while n < 20:
        if epochs.n_new_epochs == 0:
            continue  # nothing new to do
        logger.info("Got %s / %s new epochs.", epochs.n_new_epochs, n)
        n += epochs.n_new_epochs
        # get data and create evoked array
        data = epochs.get_data(n_epochs=epochs.n_new_epochs)
        new_evoked = EvokedArray(
            np.average(data, axis=0), epochs.info, nave=data.shape[0]
        )
        evoked = (
            new_evoked
            if evoked is None
            else combine_evoked([evoked, new_evoked], weights="nave")
        )
        evoked.nave = n  # overwrite to avoid numerical approximation error
        ax.clear()
        evoked.plot(axes=ax, time_unit="s")  # plot on current figure
        fig.canvas.draw()
        fig.canvas.flush_events()

    # clean-up
    epochs.disconnect()
    stream.disconnect()
Total running time of the script: (0 minutes 57.290 seconds)
Estimated memory usage: 641 MB