
Note
Go to the end to download the full example code.
Basic SSA decomposition with frequency-guided grouping#
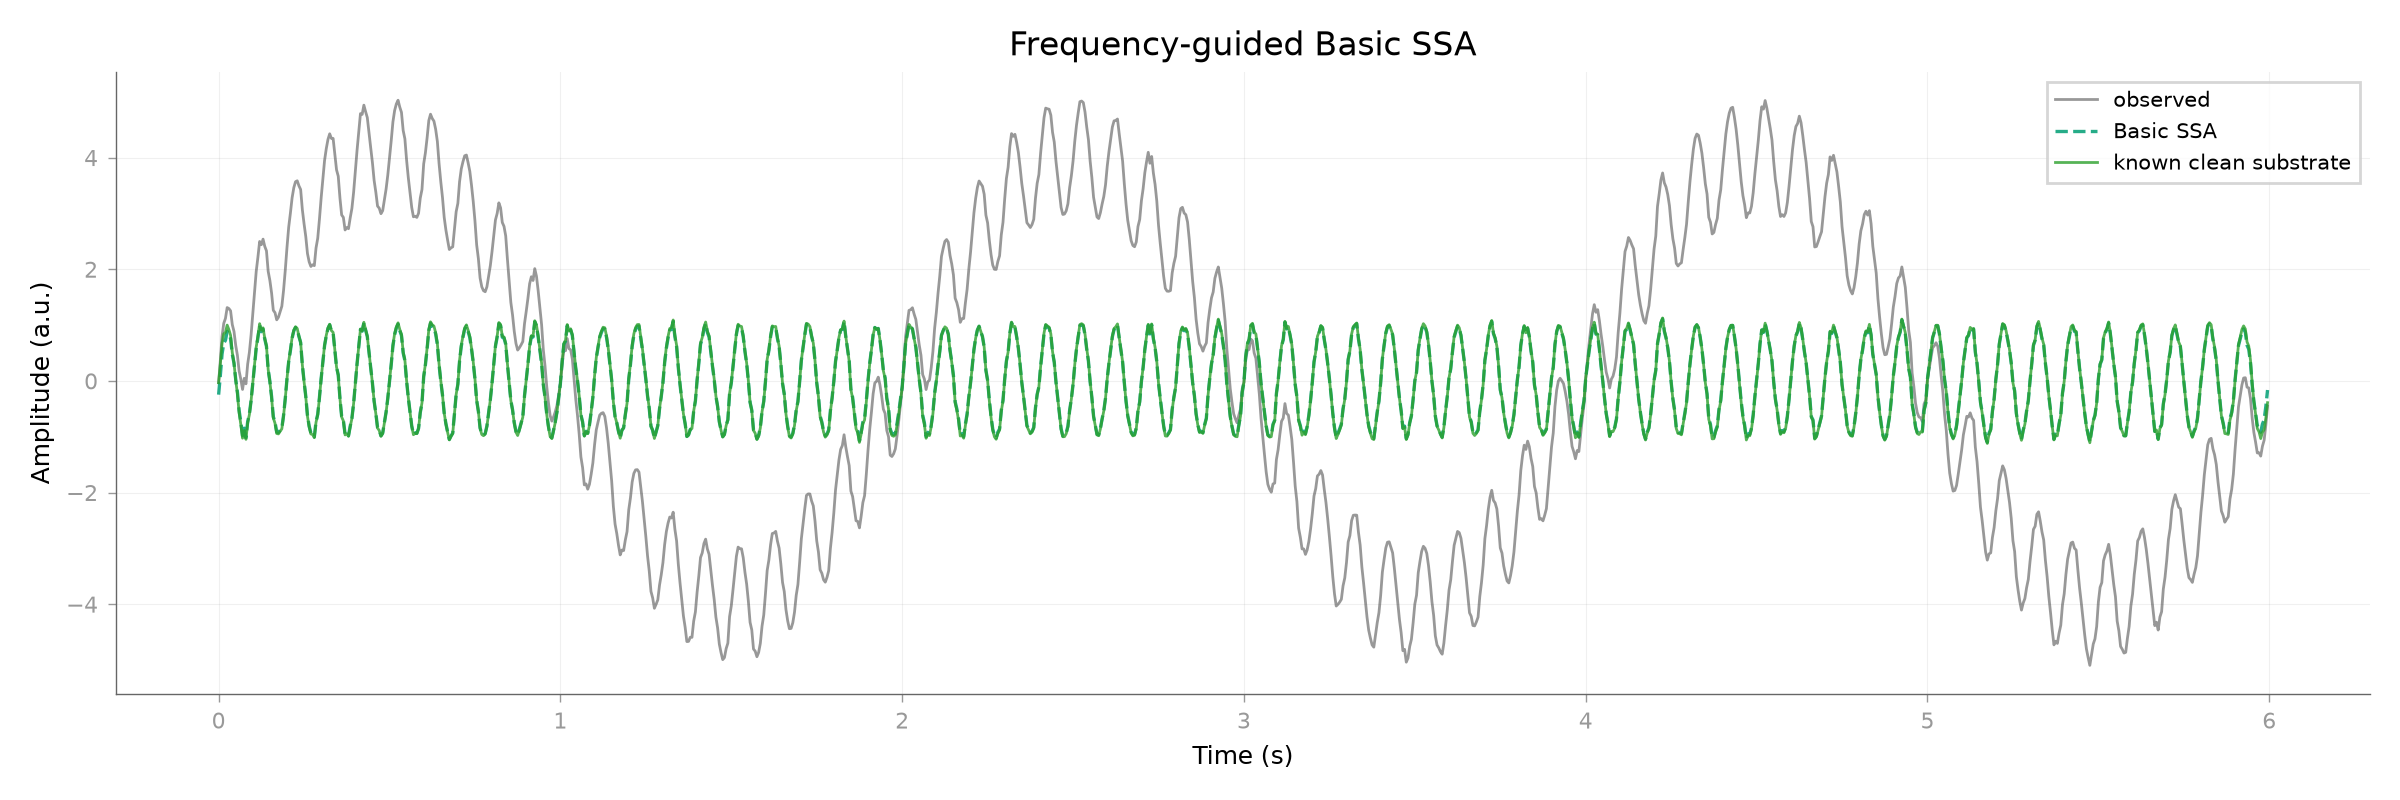
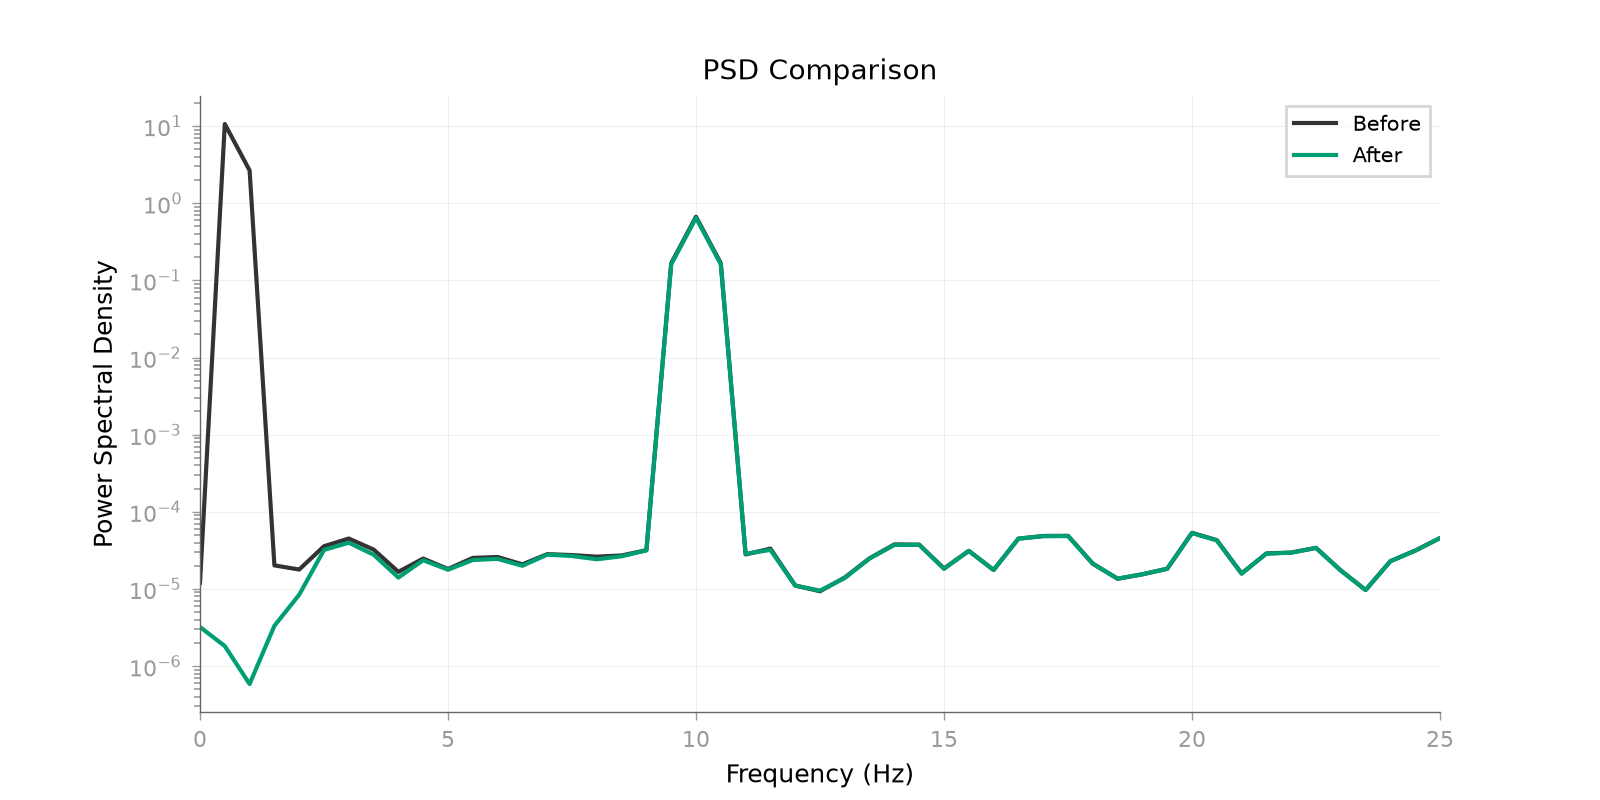
Can SSA separate additive temporal structure so that a frequency-guided grouping rule removes a slow drift while retaining a known alpha component? This compact, controlled example keeps the clean substrate explicit.
Additive decomposition by singular spectrum analysis is the established SSA concept [1]. Selecting components by dominant frequency is an mne-denoise grouping convenience, not a universal Basic SSA grouping rule.
References#
Construct the additive signal#
import numpy as np

from mne_denoise.ssa import SingularSpectrumAnalysis, ssa_decompose
from mne_denoise.viz import plot_psd_comparison, plot_signal_overlay

sfreq = 200.0
times = np.arange(1200) / sfreq
alpha = np.sin(2.0 * np.pi * 10.0 * times)
drift = 4.0 * np.sin(2.0 * np.pi * 0.5 * times)
rng = np.random.default_rng(4)
background = 0.05 * rng.standard_normal(times.size)
desired = alpha + background
observed = desired + drift
Decompose, group by dominant frequency, and evaluate the known endpoints#
components, info = ssa_decompose(observed, window_seconds=0.5, sfreq=sfreq)
reconstruction_error = np.max(np.abs(components.sum(axis=0) - observed))

cleaner = SingularSpectrumAnalysis(
    sfreq=sfreq,
    window_seconds=0.5,
    drop_freq_max=3.0,
    verbose=False,
)
cleaned = cleaner.fit_transform(observed[np.newaxis])[0]

drift_denominator = np.dot(drift, drift)
drift_before = np.dot(observed, drift) / drift_denominator
drift_after = np.dot(cleaned, drift) / drift_denominator
drift_residual_ratio = abs(drift_after / drift_before)

alpha_denominator = np.dot(alpha, alpha)
alpha_reference = np.dot(desired, alpha) / alpha_denominator
alpha_after = np.dot(cleaned, alpha) / alpha_denominator
alpha_gain = alpha_after / alpha_reference

dropped_frequencies = np.asarray(cleaner.dropped_frequencies_[0])
print(f"Additive reconstruction error: {reconstruction_error:.3e}")
print(f"Slow-drift residual ratio: {drift_residual_ratio:.3e}")
print(f"Alpha gain: {alpha_gain:.3f}")
print(f"Dropped component frequencies (Hz): {dropped_frequencies}")
Additive reconstruction error: 2.476e-14
Slow-drift residual ratio: 1.514e-04
Alpha gain: 0.981
Dropped component frequencies (Hz): [0.5 0.5]
Inspect the time-domain reconstruction#
plot_signal_overlay(
    observed,
    cleaned,
    times,
    reference=desired,
    before_label="observed",
    after_label="Basic SSA",
    reference_label="known clean substrate",
    scale_after=False,
    x_label="Time (s)",
    y_label="Amplitude (a.u.)",
    title="Frequency-guided Basic SSA",
    show=False,
)
<Figure size 2400x800 with 1 Axes>
Compare the spectra#
plot_psd_comparison(
    observed,
    cleaned,
    sfreq=sfreq,
    fmin=0.0,
    fmax=25.0,
    show=False,
)
<Figure size 1600x800 with 1 Axes>