mne_nirs.preprocessing.peak_power#
- mne_nirs.preprocessing.peak_power(raw, time_window=10, threshold=0.1, l_freq=0.7, h_freq=1.5, l_trans_bandwidth=0.3, h_trans_bandwidth=0.3, verbose=False)[source]#
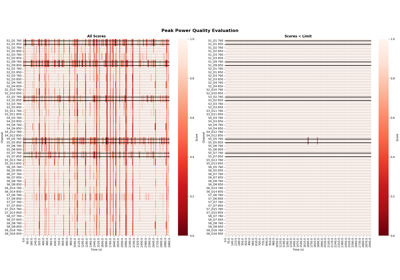
Compute peak spectral power metric for each channel and time window.
As described in [1] and [2]. This method provides a metric of data quality along the duration of the measurement. The user can specify the window over which the metric is computed.
- Parameters:
- rawinstance of
Raw The haemoglobin data.
- time_windownumber
The duration of the window over which to calculate the metric. Default is 10 seconds as in PHOEBE paper.
- thresholdnumber
Values below this are marked as bad and annotated in the raw file.
- l_freq
float|None For FIR filters, the lower pass-band edge; for IIR filters, the lower cutoff frequency. If None the data are only low-passed.
- h_freq
float|None For FIR filters, the upper pass-band edge; for IIR filters, the upper cutoff frequency. If None the data are only high-passed.
- l_trans_bandwidth
float|str Width of the transition band at the low cut-off frequency in Hz (high pass or cutoff 1 in bandpass). Can be “auto” (default) to use a multiple of
l_freq:min(max(l_freq * 0.25, 2), l_freq)
Only used for
method='fir'.- h_trans_bandwidth
float|str Width of the transition band at the high cut-off frequency in Hz (low pass or cutoff 2 in bandpass). Can be “auto” (default in 0.14) to use a multiple of
h_freq:min(max(h_freq * 0.25, 2.), info['sfreq'] / 2. - h_freq)
Only used for
method='fir'.- verbosebool |
str|int|None Control verbosity of the logging output. If
None, use the default verbosity level. See the logging documentation andmne.verbose()for details. Should only be passed as a keyword argument.
- rawinstance of
- Returns:
References
[1]Pollonini L et al., “PHOEBE: a method for real time mapping of optodes-scalp coupling in functional near-infrared spectroscopy” in Biomed. Opt. Express 7, 5104-5119 (2016).
[2]Hernandez, Samuel Montero, and Luca Pollonini. “NIRSplot: a tool for quality assessment of fNIRS scans.” Optics and the Brain. Optical Society of America, 2020.