mne_nirs.visualisation.plot_glm_surface_projection#
- mne_nirs.visualisation.plot_glm_surface_projection(inst, statsmodel_df, picks='hbo', value='Coef.', background='w', figure=None, clim='auto', mode='weighted', colormap='RdBu_r', surface='pial', hemi='both', size=800, view=None, colorbar=True, distance=0.03, subjects_dir=None, src=None, verbose=False)[source]#
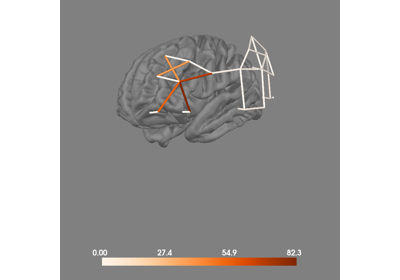
Project GLM results on to the surface of the brain.
Note: This function provides a convenient wrapper around low level MNE-Python functions. It is convenient if you wish to use a generic head model. If you have acquired fMRI images you may wish to use the underlying lower level functions.
Note: This function does not conduct a forward model analysis with photon migration etc. It simply projects the values from each channel to the local cortical surface. It is useful for visualisation, but users should take this in to consideration when drawing conclusions from the visualisation.
- Parameters:
- instinstance of
Raw Haemoglobin data.
- statsmodel_df
dataframe As produced by produced by statsmodels_to_results.
- picks
str| array_like |slice|None Channels to include. Slices and lists of integers will be interpreted as channel indices. In lists, channel type strings (e.g.,
['meg',
'eeg']
) will pick channels of those types, channel name strings (e.g.,['MEG0111', 'MEG2623']will pick the given channels. Can also be the string values'all'to pick all channels, or'data'to pick data channels. None (default) will pick good sEEG, ECoG, and DBS channels.- value
str Column from dataframe to plot.
- background
matplotlibcolor Color of the background of the display window.
- figuremayavi.core.api.Scene,
matplotlib.figure.Figure,list,int,None If None, a new figure will be created. If multiple views or a split view is requested, this must be a list of the appropriate length. If int is provided it will be used to identify the Mayavi figure by it’s id or create a new figure with the given id. If an instance of matplotlib figure, mpl backend is used for plotting.
- clim
str|dict Colorbar properties specification. If ‘auto’, set clim automatically based on data percentiles. If dict, should contain:
kind‘value’ | ‘percent’Flag to specify type of limits.
limslist | np.ndarray | tuple of float, 3 elementsLower, middle, and upper bounds for colormap.
pos_limslist | np.ndarray | tuple of float, 3 elementsLower, middle, and upper bound for colormap. Positive values will be mirrored directly across zero during colormap construction to obtain negative control points.
Note
Only one of
limsorpos_limsshould be provided. Only sequential colormaps should be used withlims, and only divergent colormaps should be used withpos_lims.- mode
str Can be “sum” to do a linear sum of weights, “weighted” to make this a weighted sum, “nearest” to use only the weight of the nearest sensor, or “single” to do a distance-weight of the nearest sensor. Default is “sum”.
- colormap
str Colormap to use.
- surface
str The type of surface (inflated, white etc.).
- hemi
str Hemisphere id (ie ‘lh’, ‘rh’, ‘both’, or ‘split’). In the case of ‘both’, both hemispheres are shown in the same window. In the case of ‘split’ hemispheres are displayed side-by-side in different viewing panes.
- size
floatortupleoffloat The size of the window, in pixels. can be one number to specify a square window, or the (width, height) of a rectangular window. Has no effect with mpl backend.
- view
str View to set brain to.
- colorbarbool
If True, display colorbar on scene.
- distance
float Distance (m) defining the activation “ball” of the sensor.
- subjects_dirpath-like |
None The path to the directory containing the FreeSurfer subjects reconstructions. If
None, defaults to theSUBJECTS_DIRenvironment variable.- srcinstance of
SourceSpaces The source space.
- verbosebool |
str|int|None Control verbosity of the logging output. If
None, use the default verbosity level. See the logging documentation andmne.verbose()for details. Should only be passed as a keyword argument.
- instinstance of
- Returns:
- figureinstance of
mne.viz.Brain|matplotlib.figure.Figure An instance of
mne.viz.Brainor matplotlib figure.
- figureinstance of