Note
Go to the end to download the full example code
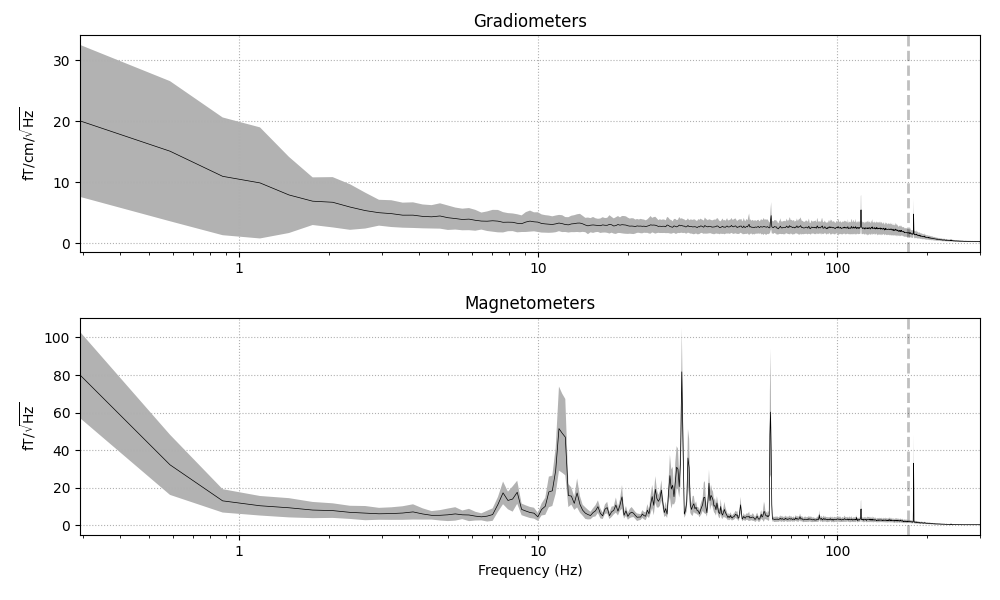
Show noise levels from empty room data#
This shows how to use mne.io.Raw.plot_psd() to examine noise levels
of systems. See [1] for an example.
# Author: Eric Larson <larson.eric.d@gmail.com>
#
# License: BSD-3-Clause
import mne

data_path = mne.datasets.sample.data_path()

raw_erm = mne.io.read_raw_fif(
    data_path / "MEG" / "sample" / "ernoise_raw.fif", preload=True
)
Opening raw data file /home/circleci/mne_data/MNE-sample-data/MEG/sample/ernoise_raw.fif...
Isotrak not found
    Read a total of 3 projection items:
        PCA-v1 (1 x 10²)  idle
        PCA-v2 (1 x 10²)  idle
        PCA-v3 (1 x 10²)  idle
    Range : 19800 ... 85867 =     32.966 ...   142.965 secs
Ready.
Reading 0 ... 66067  =      0.000 ...   109.999 secs...
We can plot the absolute noise levels:
raw_erm.compute_psd(tmax=10).plot(
    average=True,
    spatial_colors=False,
    dB=False,
    xscale="log",
    picks="data",
    exclude="bads",
)
Effective window size : 3.410 (s)
References#
Total running time of the script: ( 0 minutes 2.680 seconds)
Estimated memory usage: 168 MB