mne.time_frequency.AverageTFR#
- class mne.time_frequency.AverageTFR(info, data, times, freqs, nave, comment=None, method=None, verbose=None)[source]#
Container for Time-Frequency data.
Can for example store induced power at sensor level or inter-trial coherence.
- Parameters:
- info
mne.Info The
mne.Infoobject with information about the sensors and methods of measurement.- data
ndarray, shape (n_channels, n_freqs, n_times) The data.
- times
ndarray, shape (n_times,) The time values in seconds.
- freqs
ndarray, shape (n_freqs,) The frequencies in Hz.
- nave
int The number of averaged TFRs.
- comment
str|None, defaultNone Comment on the data, e.g., the experimental condition.
- method
str|None, defaultNone Comment on the method used to compute the data, e.g., morlet wavelet.
- verbose
bool|str|int|None Control verbosity of the logging output. If
None, use the default verbosity level. See the logging documentation andmne.verbose()for details. Should only be passed as a keyword argument.
- info
- Attributes:
- info
mne.Info The
mne.Infoobject with information about the sensors and methods of measurement.ch_nameslistChannel names.
- nave
int Number of averaged epochs.
- data
ndarray, shape (n_channels, n_freqs, n_times) The data array.
timesndarray, shape (n_times,)Time vector in seconds.
- freqs
ndarray, shape (n_freqs,) The frequencies in Hz.
- comment
str Comment on dataset. Can be the condition.
- method
str|None, defaultNone Comment on the method used to compute the data, e.g., morlet wavelet.
- info
Methods
__add__(tfr)Add instances.
__contains__(ch_type)Check channel type membership.
__mul__(a)Multiply source instances.
__sub__(tfr)Subtract instances.
add_channels(add_list[, force_update_info])Append new channels to the instance.
add_reference_channels(ref_channels)Add reference channels to data that consists of all zeros.
apply_baseline(baseline[, mode, verbose])Baseline correct the data.
copy()Return a copy of the instance.
crop([tmin, tmax, fmin, fmax, include_tmax])Crop data to a given time interval in place.
decimate(decim[, offset, verbose])Decimate the time-series data.
drop_channels(ch_names[, on_missing])Drop channel(s).
get_channel_types([picks, unique, only_data_chs])Get a list of channel type for each channel.
pick(picks[, exclude, verbose])Pick a subset of channels.
pick_channels(ch_names[, ordered, verbose])Pick some channels.
pick_types([meg, eeg, stim, eog, ecg, emg, ...])Pick some channels by type and names.
plot([picks, baseline, mode, tmin, tmax, ...])Plot TFRs as a two-dimensional image(s).
plot_joint([timefreqs, picks, baseline, ...])Plot TFRs as a two-dimensional image with topomaps.
plot_topo([picks, baseline, mode, tmin, ...])Plot TFRs in a topography with images.
plot_topomap([tmin, tmax, fmin, fmax, ...])Plot topographic maps of time-frequency intervals of TFR data.
reorder_channels(ch_names)Reorder channels.
save(fname[, overwrite, verbose])Save TFR object to hdf5 file.
shift_time(tshift[, relative])Shift time scale in epoched or evoked data.
time_as_index(times[, use_rounding])Convert time to indices.
to_data_frame([picks, index, long_format, ...])Export data in tabular structure as a pandas DataFrame.
- __contains__(ch_type)[source]#
Check channel type membership.
- Parameters:
- ch_type
str Channel type to check for. Can be e.g. ‘meg’, ‘eeg’, ‘stim’, etc.
- ch_type
- Returns:
- in
bool Whether or not the instance contains the given channel type.
- in
Examples
Channel type membership can be tested as:
>>> 'meg' in inst
True
>>> 'seeg' in inst
False
- add_channels(add_list, force_update_info=False)[source]#
Append new channels to the instance.
- Parameters:
- add_list
list A list of objects to append to self. Must contain all the same type as the current object.
- force_update_info
bool If True, force the info for objects to be appended to match the values in
self. This should generally only be used when adding stim channels for which important metadata won’t be overwritten.New in version 0.12.
- add_list
- Returns:
See also
Notes
If
selfis a Raw instance that has been preloaded into anumpy.memmapinstance, the memmap will be resized.
- add_reference_channels(ref_channels)[source]#
Add reference channels to data that consists of all zeros.
Adds reference channels to data that were not included during recording. This is useful when you need to re-reference your data to different channels. These added channels will consist of all zeros.
- Parameters:
- Returns:
- apply_baseline(baseline, mode='mean', verbose=None)[source]#
Baseline correct the data.
- Parameters:
- baselinearray_like, shape (2,)
The time interval to apply rescaling / baseline correction. If None do not apply it. If baseline is (a, b) the interval is between “a (s)” and “b (s)”. If a is None the beginning of the data is used and if b is None then b is set to the end of the interval. If baseline is equal to (None, None) all the time interval is used.
- mode‘mean’ | ‘ratio’ | ‘logratio’ | ‘percent’ | ‘zscore’ | ‘zlogratio’
Perform baseline correction by
subtracting the mean of baseline values (‘mean’)
dividing by the mean of baseline values (‘ratio’)
dividing by the mean of baseline values and taking the log (‘logratio’)
subtracting the mean of baseline values followed by dividing by the mean of baseline values (‘percent’)
subtracting the mean of baseline values and dividing by the standard deviation of baseline values (‘zscore’)
dividing by the mean of baseline values, taking the log, and dividing by the standard deviation of log baseline values (‘zlogratio’)
- verbose
bool|str|int|None Control verbosity of the logging output. If
None, use the default verbosity level. See the logging documentation andmne.verbose()for details. Should only be passed as a keyword argument.
- Returns:
- instinstance of
AverageTFR The modified instance.
- instinstance of
- property ch_names#
Channel names.
- property compensation_grade#
The current gradient compensation grade.
- copy()[source]#
Return a copy of the instance.
- Returns:
- copyinstance of
EpochsTFR| instance ofAverageTFR A copy of the instance.
- copyinstance of
- crop(tmin=None, tmax=None, fmin=None, fmax=None, include_tmax=True)[source]#
Crop data to a given time interval in place.
- Parameters:
- tmin
float|None Start time of selection in seconds.
- tmax
float|None End time of selection in seconds.
- fmin
float|None Lowest frequency of selection in Hz.
New in version 0.18.0.
- fmax
float|None Highest frequency of selection in Hz.
New in version 0.18.0.
- include_tmax
bool If True (default), include tmax. If False, exclude tmax (similar to how Python indexing typically works).
New in version 0.19.
- tmin
- Returns:
- instinstance of
AverageTFR The modified instance.
- instinstance of
- decimate(decim, offset=0, verbose=None)[source]#
Decimate the time-series data.
- Parameters:
- decim
int Factor by which to subsample the data.
Warning
Low-pass filtering is not performed, this simply selects every Nth sample (where N is the value passed to
decim), i.e., it compresses the signal (see Notes). If the data are not properly filtered, aliasing artifacts may occur.- offset
int Apply an offset to where the decimation starts relative to the sample corresponding to t=0. The offset is in samples at the current sampling rate.
New in version 0.12.
- verbose
bool|str|int|None Control verbosity of the logging output. If
None, use the default verbosity level. See the logging documentation andmne.verbose()for details. Should only be passed as a keyword argument.
- decim
- Returns:
- instMNE-object
The decimated object.
See also
Notes
For historical reasons,
decim/ “decimation” refers to simply subselecting samples from a given signal. This contrasts with the broader signal processing literature, where decimation is defined as (quoting [1], p. 172; which cites [2]):“… a general system for downsampling by a factor of M is the one shown in Figure 4.23. Such a system is called a decimator, and downsampling by lowpass filtering followed by compression [i.e, subselecting samples] has been termed decimation (Crochiere and Rabiner, 1983).”
Hence “decimation” in MNE is what is considered “compression” in the signal processing community.
Decimation can be done multiple times. For example,
inst.decimate(2).decimate(2)will be the same asinst.decimate(4).If
decimis 1, this method does not copy the underlying data.New in version 0.10.0.
References
- drop_channels(ch_names, on_missing='raise')[source]#
Drop channel(s).
- Parameters:
- ch_namesiterable or
str Iterable (e.g. list) of channel name(s) or channel name to remove.
- on_missing‘raise’ | ‘warn’ | ‘ignore’
Can be
'raise'(default) to raise an error,'warn'to emit a warning, or'ignore'to ignore when entries in ch_names are not present in the raw instance.New in version 0.23.0.
- ch_namesiterable or
- Returns:
See also
Notes
New in version 0.9.0.
- get_channel_types(picks=None, unique=False, only_data_chs=False)[source]#
Get a list of channel type for each channel.
- Parameters:
- picks
str| array_like |slice|None Channels to include. Slices and lists of integers will be interpreted as channel indices. In lists, channel type strings (e.g.,
['meg',
'eeg']
) will pick channels of those types, channel name strings (e.g.,['MEG0111', 'MEG2623']will pick the given channels. Can also be the string values “all” to pick all channels, or “data” to pick data channels. None (default) will pick all channels. Note that channels ininfo['bads']will be included if their names or indices are explicitly provided.- unique
bool Whether to return only unique channel types. Default is
False.- only_data_chs
bool Whether to ignore non-data channels. Default is
False.
- picks
- Returns:
- channel_types
list The channel types.
- channel_types
- pick(picks, exclude=(), *, verbose=None)[source]#
Pick a subset of channels.
- Parameters:
- picks
str| array_like |slice|None Channels to include. Slices and lists of integers will be interpreted as channel indices. In lists, channel type strings (e.g.,
['meg',
'eeg']
) will pick channels of those types, channel name strings (e.g.,['MEG0111', 'MEG2623']will pick the given channels. Can also be the string values “all” to pick all channels, or “data” to pick data channels. None (default) will pick all channels. Note that channels ininfo['bads']will be included if their names or indices are explicitly provided.- exclude
list|str Set of channels to exclude, only used when picking based on types (e.g., exclude=”bads” when picks=”meg”).
- verbose
bool|str|int|None Control verbosity of the logging output. If
None, use the default verbosity level. See the logging documentation andmne.verbose()for details. Should only be passed as a keyword argument.New in version 0.24.0.
- picks
- Returns:
- pick_channels(ch_names, ordered=False, *, verbose=None)[source]#
Pick some channels.
- Parameters:
- ch_names
list The list of channels to select.
- ordered
bool If True (default False), ensure that the order of the channels in the modified instance matches the order of
ch_names.New in version 0.20.0.
- verbose
bool|str|int|None Control verbosity of the logging output. If
None, use the default verbosity level. See the logging documentation andmne.verbose()for details. Should only be passed as a keyword argument.New in version 1.1.
- ch_names
- Returns:
See also
Notes
The channel names given are assumed to be a set, i.e. the order does not matter. The original order of the channels is preserved. You can use
reorder_channelsto set channel order if necessary.New in version 0.9.0.
- pick_types(meg=False, eeg=False, stim=False, eog=False, ecg=False, emg=False, ref_meg='auto', *, misc=False, resp=False, chpi=False, exci=False, ias=False, syst=False, seeg=False, dipole=False, gof=False, bio=False, ecog=False, fnirs=False, csd=False, dbs=False, temperature=False, gsr=False, include=(), exclude='bads', selection=None, verbose=None)[source]#
Pick some channels by type and names.
- Parameters:
- meg
bool|str If True include MEG channels. If string it can be ‘mag’, ‘grad’, ‘planar1’ or ‘planar2’ to select only magnetometers, all gradiometers, or a specific type of gradiometer.
- eeg
bool If True include EEG channels.
- stim
bool If True include stimulus channels.
- eog
bool If True include EOG channels.
- ecg
bool If True include ECG channels.
- emg
bool If True include EMG channels.
- ref_meg
bool|str If True include CTF / 4D reference channels. If ‘auto’, reference channels are included if compensations are present and
megis not False. Can also be the string options for themegparameter.- misc
bool If True include miscellaneous analog channels.
- resp
bool If
Trueinclude respiratory channels.- chpi
bool If True include continuous HPI coil channels.
- exci
bool Flux excitation channel used to be a stimulus channel.
- ias
bool Internal Active Shielding data (maybe on Triux only).
- syst
bool System status channel information (on Triux systems only).
- seeg
bool Stereotactic EEG channels.
- dipole
bool Dipole time course channels.
- gof
bool Dipole goodness of fit channels.
- bio
bool Bio channels.
- ecog
bool Electrocorticography channels.
- fnirs
bool|str Functional near-infrared spectroscopy channels. If True include all fNIRS channels. If False (default) include none. If string it can be ‘hbo’ (to include channels measuring oxyhemoglobin) or ‘hbr’ (to include channels measuring deoxyhemoglobin).
- csd
bool EEG-CSD channels.
- dbs
bool Deep brain stimulation channels.
- temperature
bool Temperature channels.
- gsr
bool Galvanic skin response channels.
- include
listofstr List of additional channels to include. If empty do not include any.
- exclude
listofstr|str List of channels to exclude. If ‘bads’ (default), exclude channels in
info['bads'].- selection
listofstr Restrict sensor channels (MEG, EEG, etc.) to this list of channel names.
- verbose
bool|str|int|None Control verbosity of the logging output. If
None, use the default verbosity level. See the logging documentation andmne.verbose()for details. Should only be passed as a keyword argument.
- meg
- Returns:
See also
Notes
New in version 0.9.0.
- plot(picks=None, baseline=None, mode='mean', tmin=None, tmax=None, fmin=None, fmax=None, vmin=None, vmax=None, cmap='RdBu_r', dB=False, colorbar=True, show=True, title=None, axes=None, layout=None, yscale='auto', mask=None, mask_style=None, mask_cmap='Greys', mask_alpha=0.1, combine=None, exclude=[], cnorm=None, verbose=None)[source]#
Plot TFRs as a two-dimensional image(s).
- Parameters:
- picks
str| array_like |slice|None Channels to include. Slices and lists of integers will be interpreted as channel indices. In lists, channel type strings (e.g.,
['meg',
'eeg']
) will pick channels of those types, channel name strings (e.g.,['MEG0111', 'MEG2623']will pick the given channels. Can also be the string values “all” to pick all channels, or “data” to pick data channels. None (default) will pick good data channels. Note that channels ininfo['bads']will be included if their names or indices are explicitly provided.- baseline
None(default) ortuple, shape (2,) The time interval to apply baseline correction. If None do not apply it. If baseline is (a, b) the interval is between “a (s)” and “b (s)”. If a is None the beginning of the data is used and if b is None then b is set to the end of the interval. If baseline is equal to (None, None) all the time interval is used.
- mode‘mean’ | ‘ratio’ | ‘logratio’ | ‘percent’ | ‘zscore’ | ‘zlogratio’
Perform baseline correction by
subtracting the mean of baseline values (‘mean’) (default)
dividing by the mean of baseline values (‘ratio’)
dividing by the mean of baseline values and taking the log (‘logratio’)
subtracting the mean of baseline values followed by dividing by the mean of baseline values (‘percent’)
subtracting the mean of baseline values and dividing by the standard deviation of baseline values (‘zscore’)
dividing by the mean of baseline values, taking the log, and dividing by the standard deviation of log baseline values (‘zlogratio’)
- tmin
None|float The first time instant to display. If None the first time point available is used. Defaults to None.
- tmax
None|float The last time instant to display. If None the last time point available is used. Defaults to None.
- fmin
None|float The first frequency to display. If None the first frequency available is used. Defaults to None.
- fmax
None|float The last frequency to display. If None the last frequency available is used. Defaults to None.
- vmin
float|None The minimum value an the color scale. If vmin is None, the data minimum value is used. Defaults to None.
- vmax
float|None The maximum value an the color scale. If vmax is None, the data maximum value is used. Defaults to None.
- cmapmatplotlib colormap | ‘interactive’ | (colormap,
bool) The colormap to use. If tuple, the first value indicates the colormap to use and the second value is a boolean defining interactivity. In interactive mode the colors are adjustable by clicking and dragging the colorbar with left and right mouse button. Left mouse button moves the scale up and down and right mouse button adjusts the range. Hitting space bar resets the range. Up and down arrows can be used to change the colormap. If ‘interactive’, translates to (‘RdBu_r’, True). Defaults to ‘RdBu_r’.
Warning
Interactive mode works smoothly only for a small amount of images.
- dB
bool If True, 10*log10 is applied to the data to get dB. Defaults to False.
- colorbar
bool If true, colorbar will be added to the plot. Defaults to True.
- show
bool Call pyplot.show() at the end. Defaults to True.
- title
str| ‘auto’ |None String for
title. Defaults to None (blank/no title). If ‘auto’, andcombineis None, the title for each figure will be the channel name. If ‘auto’ andcombineis not None,titlestates how many channels were combined into that figure and the method that was used forcombine. If str, that String will be the title for each figure.- axesinstance of
Axes|list|None The axes to plot to. If list, the list must be a list of Axes of the same length as
picks. If instance of Axes, there must be only one channel plotted. Ifcombineis not None,axesmust either be an instance of Axes, or a list of length 1.- layout
Layout|None Layout instance specifying sensor positions. Used for interactive plotting of topographies on rectangle selection. If possible, the correct layout is inferred from the data.
- yscale‘auto’ (default) | ‘linear’ | ‘log’
The scale of y (frequency) axis. ‘linear’ gives linear y axis, ‘log’ leads to log-spaced y axis and ‘auto’ detects if frequencies are log-spaced and only then sets the y axis to ‘log’.
New in version 0.14.0.
- mask
ndarray|None An array of booleans of the same shape as the data. Entries of the data that correspond to False in the mask are plotted transparently. Useful for, e.g., masking for statistical significance.
New in version 0.16.0.
- mask_style
None| ‘both’ | ‘contour’ | ‘mask’ If
maskis not None: if'contour', a contour line is drawn around the masked areas (Trueinmask). If'mask', entries notTrueinmaskare shown transparently. If'both', both a contour and transparency are used. IfNone, defaults to'both'ifmaskis not None, and is ignored otherwise.New in version 0.17.
- mask_cmapmatplotlib colormap | (colormap,
bool) | ‘interactive’ The colormap chosen for masked parts of the image (see below), if
maskis notNone. If None,cmapis reused. Defaults to'Greys'. Not interactive. Otherwise, ascmap.New in version 0.17.
- mask_alpha
float A float between 0 and 1. If
maskis not None, this sets the alpha level (degree of transparency) for the masked-out segments. I.e., if 0, masked-out segments are not visible at all. Defaults to 0.1.New in version 0.16.0.
- combine‘mean’ | ‘rms’ |
None Type of aggregation to perform across selected channels. If None, plot one figure per selected channel.
- exclude
listofstr| ‘bads’ Channels names to exclude from being shown. If ‘bads’, the bad channels are excluded. Defaults to an empty list.
- cnorm
matplotlib.colors.Normalize|None How to normalize the colormap. If
None, standard linear normalization is performed. If notNone,vminandvmaxwill be ignored. See Matplotlib docs for more details on colormap normalization, and the ERDs example for an example of its use.New in version 0.24.
- verbose
bool|str|int|None Control verbosity of the logging output. If
None, use the default verbosity level. See the logging documentation andmne.verbose()for details. Should only be passed as a keyword argument.
- picks
- Returns:
- figs
listof instances ofmatplotlib.figure.Figure A list of figures containing the time-frequency power.
- figs
Examples using
plot: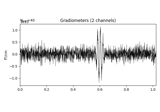
Time-frequency on simulated data (Multitaper vs. Morlet vs. Stockwell vs. Hilbert)
Time-frequency on simulated data (Multitaper vs. Morlet vs. Stockwell vs. Hilbert)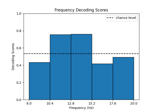
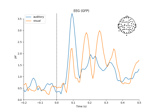
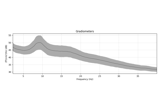
Decoding in time-frequency space using Common Spatial Patterns (CSP)
Decoding in time-frequency space using Common Spatial Patterns (CSP)
- plot_joint(timefreqs=None, picks=None, baseline=None, mode='mean', tmin=None, tmax=None, fmin=None, fmax=None, vmin=None, vmax=None, cmap='RdBu_r', dB=False, colorbar=True, show=True, title=None, yscale='auto', combine='mean', exclude=[], topomap_args=None, image_args=None, verbose=None)[source]#
Plot TFRs as a two-dimensional image with topomaps.
- Parameters:
- timefreqs
None|listoftuple|dictoftuple The time-frequency point(s) for which topomaps will be plotted. See Notes.
- picks
str| array_like |slice|None Channels to include. Slices and lists of integers will be interpreted as channel indices. In lists, channel type strings (e.g.,
['meg',
'eeg']
) will pick channels of those types, channel name strings (e.g.,['MEG0111', 'MEG2623']will pick the given channels. Can also be the string values “all” to pick all channels, or “data” to pick data channels. None (default) will pick good data channels. Note that channels ininfo['bads']will be included if their names or indices are explicitly provided.- baseline
None(default) ortupleof length 2 The time interval to apply baseline correction. If None do not apply it. If baseline is (a, b) the interval is between “a (s)” and “b (s)”. If a is None, the beginning of the data is used. If b is None, then b is set to the end of the interval. If baseline is equal to (None, None), the entire time interval is used.
- mode
None|str If str, must be one of ‘ratio’, ‘zscore’, ‘mean’, ‘percent’, ‘logratio’ and ‘zlogratio’. Do baseline correction with ratio (power is divided by mean power during baseline) or zscore (power is divided by standard deviation of power during baseline after subtracting the mean, power = [power - mean(power_baseline)] / std(power_baseline)), mean simply subtracts the mean power, percent is the same as applying ratio then mean, logratio is the same as mean but then rendered in log-scale, zlogratio is the same as zscore but data is rendered in log-scale first. If None no baseline correction is applied.
- tmin, tmax
float|None First and last times to include, in seconds.
Noneuses the first or last time present in the data. Default istmin=None, tmax=None(all times).- fmin, fmax
float The lower- and upper-bound on frequencies of interest. Default is
fmin=0, fmax=np.inf(spans all frequencies present in the data).- vmin
float|None The minimum value of the color scale for the image (for topomaps, see
topomap_args). If vmin is None, the data absolute minimum value is used.- vmax
float|None The maximum value of the color scale for the image (for topomaps, see
topomap_args). If vmax is None, the data absolute maximum value is used.- cmapmatplotlib colormap
The colormap to use.
- dB
bool If True, 10*log10 is applied to the data to get dB.
- colorbar
bool If true, colorbar will be added to the plot (relating to the topomaps). For user defined axes, the colorbar cannot be drawn. Defaults to True.
- show
bool Call pyplot.show() at the end.
- title
str|None String for title. Defaults to None (blank/no title).
- yscale‘auto’ (default) | ‘linear’ | ‘log’
The scale of y (frequency) axis. ‘linear’ gives linear y axis, ‘log’ leads to log-spaced y axis and ‘auto’ detects if frequencies are log-spaced and only then sets the y axis to ‘log’.
- combine‘mean’ | ‘rms’
Type of aggregation to perform across selected channels.
- exclude
listofstr| ‘bads’ Channels names to exclude from being shown. If ‘bads’, the bad channels are excluded. Defaults to an empty list, i.e.,
[].- topomap_args
None|dict A dict of
kwargsthat are forwarded tomne.viz.plot_topomap()to style the topomaps.axesandshoware ignored. Iftimesis not in this dict, automatic peak detection is used. Beyond that, ifNone, no customizable arguments will be passed. Defaults toNone.- image_args
None|dict A dict of
kwargsthat are forwarded toAverageTFR.plot()to style the image.axesandshoware ignored. Beyond that, ifNone, no customizable arguments will be passed. Defaults toNone.- verbose
bool|str|int|None Control verbosity of the logging output. If
None, use the default verbosity level. See the logging documentation andmne.verbose()for details. Should only be passed as a keyword argument.
- timefreqs
- Returns:
- fig
matplotlib.figure.Figure The figure containing the topography.
- fig
Notes
timefreqshas three different modes: tuples, dicts, and auto. For (list of) tuple(s) mode, each tuple defines a pair (time, frequency) in s and Hz on the TFR plot. For example, to look at 10 Hz activity 1 second into the epoch and 3 Hz activity 300 msec into the epoch,timefreqs=((1, 10), (.3, 3))
If provided as a dictionary, (time, frequency) tuples are keys and (time_window, frequency_window) tuples are the values - indicating the width of the windows (centered on the time and frequency indicated by the key) to be averaged over. For example,
timefreqs={(1, 10): (0.1, 2)}
would translate into a window that spans 0.95 to 1.05 seconds, as well as 9 to 11 Hz. If None, a single topomap will be plotted at the absolute peak across the time-frequency representation.
New in version 0.16.0.
Examples using
plot_joint:
- plot_topo(picks=None, baseline=None, mode='mean', tmin=None, tmax=None, fmin=None, fmax=None, vmin=None, vmax=None, layout=None, cmap='RdBu_r', title=None, dB=False, colorbar=True, layout_scale=0.945, show=True, border='none', fig_facecolor='k', fig_background=None, font_color='w', yscale='auto', verbose=None)[source]#
Plot TFRs in a topography with images.
- Parameters:
- picks
str| array_like |slice|None Channels to include. Slices and lists of integers will be interpreted as channel indices. In lists, channel type strings (e.g.,
['meg',
'eeg']
) will pick channels of those types, channel name strings (e.g.,['MEG0111', 'MEG2623']will pick the given channels. Can also be the string values “all” to pick all channels, or “data” to pick data channels. None (default) will pick good data channels. Note that channels ininfo['bads']will be included if their names or indices are explicitly provided.- baseline
None(default) ortupleof length 2 The time interval to apply baseline correction. If None do not apply it. If baseline is (a, b) the interval is between “a (s)” and “b (s)”. If a is None the beginning of the data is used and if b is None then b is set to the end of the interval. If baseline is equal to (None, None) all the time interval is used.
- mode‘mean’ | ‘ratio’ | ‘logratio’ | ‘percent’ | ‘zscore’ | ‘zlogratio’
Perform baseline correction by
subtracting the mean of baseline values (‘mean’)
dividing by the mean of baseline values (‘ratio’)
dividing by the mean of baseline values and taking the log (‘logratio’)
subtracting the mean of baseline values followed by dividing by the mean of baseline values (‘percent’)
subtracting the mean of baseline values and dividing by the standard deviation of baseline values (‘zscore’)
dividing by the mean of baseline values, taking the log, and dividing by the standard deviation of log baseline values (‘zlogratio’)
- tmin
None|float The first time instant to display. If None the first time point available is used.
- tmax
None|float The last time instant to display. If None the last time point available is used.
- fmin
None|float The first frequency to display. If None the first frequency available is used.
- fmax
None|float The last frequency to display. If None the last frequency available is used.
- vmin
float|None The minimum value of the color scale. If vmin is None, the data minimum value is used.
- vmax
float|None The maximum value of the color scale. If vmax is None, the data maximum value is used.
- layout
Layout|None Layout instance specifying sensor positions. If possible, the correct layout is inferred from the data.
- cmapmatplotlib colormap |
str The colormap to use. Defaults to ‘RdBu_r’.
- title
str Title of the figure.
- dB
bool If True, 10*log10 is applied to the data to get dB.
- colorbar
bool If true, colorbar will be added to the plot.
- layout_scale
float Scaling factor for adjusting the relative size of the layout on the canvas.
- show
bool Call pyplot.show() at the end.
- border
str Matplotlib borders style to be used for each sensor plot.
- fig_facecolorcolor
The figure face color. Defaults to black.
- fig_background
None|array A background image for the figure. This must be a valid input to
matplotlib.pyplot.imshow. Defaults to None.- font_colorcolor
The color of tick labels in the colorbar. Defaults to white.
- yscale‘auto’ (default) | ‘linear’ | ‘log’
The scale of y (frequency) axis. ‘linear’ gives linear y axis, ‘log’ leads to log-spaced y axis and ‘auto’ detects if frequencies are log-spaced and only then sets the y axis to ‘log’.
- verbose
bool|str|int|None Control verbosity of the logging output. If
None, use the default verbosity level. See the logging documentation andmne.verbose()for details. Should only be passed as a keyword argument.
- picks
- Returns:
- fig
matplotlib.figure.Figure The figure containing the topography.
- fig
Examples using
plot_topo:
- plot_topomap(tmin=None, tmax=None, fmin=0.0, fmax=inf, *, ch_type=None, baseline=None, mode='mean', sensors=True, show_names=False, mask=None, mask_params=None, contours=6, outlines='head', sphere=None, image_interp='cubic', extrapolate='auto', border='mean', res=64, size=2, cmap=None, vlim=(None, None), vmin=None, vmax=None, cnorm=None, colorbar=True, cbar_fmt='%1.1e', unit=None, units=None, axes=None, title=None, show=True)[source]#
Plot topographic maps of time-frequency intervals of TFR data.
- Parameters:
- tmin, tmax
float|None First and last times to include, in seconds.
Noneuses the first or last time present in the data. Default istmin=None, tmax=None(all times).- fmin, fmax
float The lower- and upper-bound on frequencies of interest. Default is
fmin=0, fmax=np.inf(spans all frequencies present in the data).- ch_type‘mag’ | ‘grad’ | ‘planar1’ | ‘planar2’ | ‘eeg’ |
None The channel type to plot. For
'grad', the gradiometers are collected in pairs and the mean for each pair is plotted. IfNonethe first available channel type from order shown above is used. Defaults toNone.- baseline
tupleorlistof length 2 The time interval to apply rescaling / baseline correction. If None do not apply it. If baseline is (a, b) the interval is between “a (s)” and “b (s)”. If a is None the beginning of the data is used and if b is None then b is set to the end of the interval. If baseline is equal to (None, None) all the time interval is used.
- mode‘mean’ | ‘ratio’ | ‘logratio’ | ‘percent’ | ‘zscore’ | ‘zlogratio’
Perform baseline correction by
subtracting the mean of baseline values (‘mean’)
dividing by the mean of baseline values (‘ratio’)
dividing by the mean of baseline values and taking the log (‘logratio’)
subtracting the mean of baseline values followed by dividing by the mean of baseline values (‘percent’)
subtracting the mean of baseline values and dividing by the standard deviation of baseline values (‘zscore’)
dividing by the mean of baseline values, taking the log, and dividing by the standard deviation of log baseline values (‘zlogratio’)
- sensors
bool|str Whether to add markers for sensor locations. If
str, should be a valid matplotlib format string (e.g.,'r+'for red plusses, see the Notes section ofplot()). IfTrue(the default), black circles will be used.- show_names
bool|callable() If
True, show channel names next to each sensor marker. If callable, channel names will be formatted using the callable; e.g., to delete the prefix ‘MEG ‘ from all channel names, pass the functionlambda x: x.replace('MEG ', ''). Ifmaskis notNone, only non-masked sensor names will be shown.- mask
ndarrayofbool, shape (n_channels, n_times) |None Array indicating channel-time combinations to highlight with a distinct plotting style (useful for, e.g. marking which channels at which times a statistical test of the data reaches significance). Array elements set to
Truewill be plotted with the parameters given inmask_params. Defaults toNone, equivalent to an array of allFalseelements.- mask_params
dict|None Additional plotting parameters for plotting significant sensors. Default (None) equals:
dict(marker='o', markerfacecolor='w', markeredgecolor='k',
        linewidth=0, markersize=4)
- contours
int| array_like The number of contour lines to draw. If
0, no contours will be drawn. If a positive integer, that number of contour levels are chosen using the matplotlib tick locator (may sometimes be inaccurate, use array for accuracy). If array-like, the array values are used as the contour levels. The values should be in µV for EEG, fT for magnetometers and fT/m for gradiometers. Ifcolorbar=True, the colorbar will have ticks corresponding to the contour levels. Default is6.- outlines‘head’ | ‘skirt’ |
dict|None The outlines to be drawn. If ‘head’, the default head scheme will be drawn. If ‘skirt’ the head scheme will be drawn, but sensors are allowed to be plotted outside of the head circle. If dict, each key refers to a tuple of x and y positions, the values in ‘mask_pos’ will serve as image mask. Alternatively, a matplotlib patch object can be passed for advanced masking options, either directly or as a function that returns patches (required for multi-axis plots). If None, nothing will be drawn. Defaults to ‘head’.
Deprecated since version v1.2: The
outlines='skirt'option is no longer supported and will raise an error starting in version 1.3. Passoutlines='head', sphere='eeglab'for similar behavior.- sphere
float| array_like | instance ofConductorModel|None| ‘auto’ | ‘eeglab’ The sphere parameters to use for the head outline. Can be array-like of shape (4,) to give the X/Y/Z origin and radius in meters, or a single float to give just the radius (origin assumed 0, 0, 0). Can also be an instance of a spherical
ConductorModelto use the origin and radius from that object. If'auto'the sphere is fit to digitization points. If'eeglab'the head circle is defined by EEG electrodes'Fpz','Oz','T7', and'T8'(if'Fpz'is not present, it will be approximated from the coordinates of'Oz').None(the default) is equivalent to'auto'when enough extra digitization points are available, and (0, 0, 0, 0.095) otherwise.New in version 0.20.
Changed in version 1.1: Added
'eeglab'option.- image_interp
str The image interpolation to be used. Options are
'cubic'(default) to usescipy.interpolate.CloughTocher2DInterpolator,'nearest'to usescipy.spatial.Voronoior'linear'to usescipy.interpolate.LinearNDInterpolator.- extrapolate
str Options:
'box'Extrapolate to four points placed to form a square encompassing all data points, where each side of the square is three times the range of the data in the respective dimension.
'local'(default for MEG sensors)Extrapolate only to nearby points (approximately to points closer than median inter-electrode distance). This will also set the mask to be polygonal based on the convex hull of the sensors.
'head'(default for non-MEG sensors)Extrapolate out to the edges of the clipping circle. This will be on the head circle when the sensors are contained within the head circle, but it can extend beyond the head when sensors are plotted outside the head circle.
Changed in version 0.21:
The default was changed to
'local'for MEG sensors.'local'was changed to use a convex hull mask'head'was changed to extrapolate out to the clipping circle.
- border
float| ‘mean’ Value to extrapolate to on the topomap borders. If
'mean'(default), then each extrapolated point has the average value of its neighbours.New in version 0.20.
- res
int The resolution of the topomap image (number of pixels along each side).
- size
float Side length of each subplot in inches.
- cmapmatplotlib colormap | (colormap,
bool) | ‘interactive’ |None Colormap to use. If
tuple, the first value indicates the colormap to use and the second value is a boolean defining interactivity. In interactive mode the colors are adjustable by clicking and dragging the colorbar with left and right mouse button. Left mouse button moves the scale up and down and right mouse button adjusts the range. Hitting space bar resets the range. Up and down arrows can be used to change the colormap. IfNone,'Reds'is used for data that is either all-positive or all-negative, and'RdBu_r'is used otherwise.'interactive'is equivalent to(None, True). Defaults toNone.Warning
Interactive mode works smoothly only for a small amount of topomaps. Interactive mode is disabled by default for more than 2 topomaps.
- vlim
tupleof length 2 Colormap limits to use. If a
tupleof floats, specifies the lower and upper bounds of the colormap (in that order); providingNonefor either entry will set the corresponding boundary at the min/max of the data. Defaults to(None, None).New in version 1.2.
- vmin, vmax
float|callable()|None Lower and upper bounds of the colormap, in the same units as the data. If
vminandvmaxare bothNone, they are set at ± the maximum absolute value of the data (yielding a colormap with midpoint at 0). If only one ofvmin,vmaxisNone, will usemin(data)ormax(data), respectively. If callable, should accept aNumPy arrayof data and return a float.Deprecated since version v1.2: The
vminandvmaxparameters will be removed in version 1.3. Please use thevlimparameter instead.- cnorm
matplotlib.colors.Normalize|None How to normalize the colormap. If
None, standard linear normalization is performed. If notNone,vminandvmaxwill be ignored. See Matplotlib docs for more details on colormap normalization, and the ERDs example for an example of its use.New in version 1.2.
- colorbar
bool Plot a colorbar in the rightmost column of the figure.
- cbar_fmt
str Formatting string for colorbar tick labels. See Format Specification Mini-Language for details.
- unit
str|None The unit of the channel type used for colorbar labels.
Deprecated since version v1.2: The “unit” parameter is deprecated and will be removed in v1.3. Use “units” instead.
- units
str|None The units of the channel type; used for the colorbar label. Ignored if
colorbar=False. IfNonethe label will be “AU” indicating arbitrary units. Default isNone.- axesinstance of
Axes|None The axes to plot to. If
None, a newFigurewill be created. Default isNone.- title
str|None The title of the generated figure. If
None(default), no title is displayed.Deprecated since version v1.2: The
titleparameter will be removed in version 1.3. Please usefig.suptitle()instead.- show
bool Show the figure if
True.
- tmin, tmax
- Returns:
- fig
matplotlib.figure.Figure The figure containing the topography.
- fig
Examples using
plot_topomap:
- reorder_channels(ch_names)[source]#
Reorder channels.
- Parameters:
- ch_names
list The desired channel order.
- ch_names
- Returns:
See also
Notes
Channel names must be unique. Channels that are not in
ch_namesare dropped.New in version 0.16.0.
- save(fname, overwrite=False, *, verbose=None)[source]#
Save TFR object to hdf5 file.
- Parameters:
- fname
str The file name, which should end with
-tfr.h5.- overwrite
bool If True (default False), overwrite the destination file if it exists.
- verbose
bool|str|int|None Control verbosity of the logging output. If
None, use the default verbosity level. See the logging documentation andmne.verbose()for details. Should only be passed as a keyword argument.
- fname
See also
- shift_time(tshift, relative=True)[source]#
Shift time scale in epoched or evoked data.
- Parameters:
- tshift
float The (absolute or relative) time shift in seconds. If
relativeis True, positive tshift increases the time value associated with each sample, while negative tshift decreases it.- relative
bool If True, increase or decrease time values by
tshiftseconds. Otherwise, shift the time values such that the time of the first sample equalstshift.
- tshift
- Returns:
- epochsMNE-object
The modified instance.
Notes
This method allows you to shift the time values associated with each data sample by an arbitrary amount. It does not resample the signal or change the data values in any way.
- property times#
Time vector in seconds.
- property tmax#
Last time point.
- property tmin#
First time point.
- to_data_frame(picks=None, index=None, long_format=False, time_format=None, *, verbose=None)[source]#
Export data in tabular structure as a pandas DataFrame.
Channels are converted to columns in the DataFrame. By default, additional columns
'time','freq','epoch', and'condition'(epoch event description) are added, unlessindexis notNone(in which case the columns specified inindexwill be used to form the DataFrame’s index instead).'epoch', and'condition'are not supported forAverageTFR.- Parameters:
- picks
str| array_like |slice|None Channels to include. Slices and lists of integers will be interpreted as channel indices. In lists, channel type strings (e.g.,
['meg',
'eeg']
) will pick channels of those types, channel name strings (e.g.,['MEG0111', 'MEG2623']will pick the given channels. Can also be the string values “all” to pick all channels, or “data” to pick data channels. None (default) will pick all channels. Note that channels ininfo['bads']will be included if their names or indices are explicitly provided.- index
str|listofstr|None Kind of index to use for the DataFrame. If
None, a sequential integer index (pandas.RangeIndex) will be used. If'time', apandas.Float64Index,pandas.Int64Index, orpandas.TimedeltaIndexwill be used (depending on the value oftime_format). If a list of two or more string values, apandas.MultiIndexwill be created. Valid string values are'time','freq','epoch', and'condition'forEpochsTFRand'time'and'freq'forAverageTFR. Defaults toNone.- long_format
bool If True, the DataFrame is returned in long format where each row is one observation of the signal at a unique combination of time point, channel, epoch number, and condition. For convenience, a
ch_typecolumn is added to facilitate subsetting the resulting DataFrame. Defaults toFalse.- time_format
str|None Desired time format. If
None, no conversion is applied, and time values remain as float values in seconds. If'ms', time values will be rounded to the nearest millisecond and converted to integers. If'timedelta', time values will be converted topandas.Timedeltavalues. Default isNone.New in version 0.23.
- verbose
bool|str|int|None Control verbosity of the logging output. If
None, use the default verbosity level. See the logging documentation andmne.verbose()for details. Should only be passed as a keyword argument.
- picks
- Returns:
- dfinstance of
pandas.DataFrame A dataframe suitable for usage with other statistical/plotting/analysis packages.
- dfinstance of
Examples using mne.time_frequency.AverageTFR#
Time-frequency on simulated data (Multitaper vs. Morlet vs. Stockwell vs. Hilbert)
Decoding in time-frequency space using Common Spatial Patterns (CSP)