mne.viz.plot_cov#
- mne.viz.plot_cov(cov, info, exclude=(), colorbar=True, proj=False, show_svd=True, show=True, verbose=None)[source]#
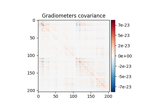
Plot Covariance data.
- Parameters
- covinstance of
Covariance The covariance matrix.
- info
mne.Info The
mne.Infoobject with information about the sensors and methods of measurement.- exclude
listofstr|str List of channels to exclude. If empty do not exclude any channel. If ‘bads’, exclude info[‘bads’].
- colorbarbool
Show colorbar or not.
- projbool
Apply projections or not.
- show_svdbool
Plot also singular values of the noise covariance for each sensor type. We show square roots ie. standard deviations.
- showbool
Show figure if True.
- verbosebool |
str|int|None Control verbosity of the logging output. If
None, use the default verbosity level. See the logging documentation andmne.verbose()for details. Should only be passed as a keyword argument.
- covinstance of
- Returns
- fig_covinstance of
matplotlib.figure.Figure The covariance plot.
- fig_svdinstance of
matplotlib.figure.Figure|None The SVD spectra plot of the covariance.
- fig_covinstance of
See also
Notes
For each channel type, the rank is estimated using
mne.compute_rank().Changed in version 0.19: Approximate ranks for each channel type are shown with red dashed lines.
Examples using mne.viz.plot_cov#
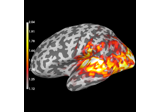
Source localization with MNE, dSPM, sLORETA, and eLORETA
Compute evoked ERS source power using DICS, LCMV beamformer, and dSPM
Compute source power estimate by projecting the covariance with MNE