Note
Go to the end to download the full example code.
Adaptive Wiener Masking for Bursty Signals.#
This example demonstrates the WienerMaskDenoiser, a nonlinear function that adapts to the local variance (envelope) of the signal.
It is particularly useful for extracting bursty or non-stationary signals such as sleep spindles, beta bursts, speech segments, or intermittent artifacts.
The denoiser estimates a time-varying mask $m(t)$ based on the local signal-to-noise ratio, dampening quiet periods and preserving high-variance bursts.
- Authors: Sina Esmaeili (sina.esmaeili@umontreal.ca)
Hamza Abdelhedi (hamza.abdelhedi@umontreal.ca)
import matplotlib.pyplot as plt
import numpy as np
from scipy import signal

from mne_denoise.dss import IterativeDSS
from mne_denoise.dss.denoisers import WienerMaskDenoiser

print(__doc__)
1. Generate Synthetic Data with Bursts#
We create a signal that is “bursty”: an oscillation that turns on and off. We mix it with stationary background noise.
n_samples = 2000
sfreq = 200
time = np.arange(n_samples) / sfreq

# Source 1: Bursty Oscillation (Target)
# Amplitude Modulation: envelope is a slow pulse train
envelope = np.zeros(n_samples)
# Create 3 bursts
envelope[400:600] = 1.0  # Burst 1
envelope[1000:1200] = 1.0  # Burst 2
envelope[1600:1800] = 1.0  # Burst 3
# Smooth the envelope
envelope = signal.convolve(envelope, signal.windows.hann(100), mode="same")
envelope /= envelope.max()

# Carrier: 12 Hz sine wave
s1 = envelope * np.sin(2 * np.pi * 12 * time)
s1 /= s1.std()

# Source 2: Stationary Background (Distractor)
# Continuous 5 Hz oscillation
s2 = np.sin(2 * np.pi * 5 * time)
s2 /= s2.std()

# Source 3: White Noise
rng = np.random.default_rng(42)
s3 = rng.standard_normal(n_samples)

S = np.array([s1, s2, s3])
n_sources = S.shape[0]

# Mixing
A = rng.standard_normal((6, n_sources))  # 6 channels
X = A @ S
# Add sensor noise
X += 0.2 * rng.standard_normal(X.shape)

print(f"Data shape: {X.shape} (6 channels, {n_samples} samples)")
print("Target: 12 Hz Bursts (Source 0)")
Data shape: (6, 2000) (6 channels, 2000 samples)
Target: 12 Hz Bursts (Source 0)
2. Apply DSS with WienerMaskDenoiser#
The denoiser will estimate the local variance within a window and apply a soft mask.
print("\nRunning IterativeDSS with WienerMaskDenoiser...")

# Window should be roughly the duration of a burst or shorter to track changes
# 12Hz burst, window of ~200ms (40 samples)
denoiser = WienerMaskDenoiser(window_samples=40, noise_percentile=25)

dss = IterativeDSS(denoiser=denoiser, n_components=3, max_iter=20, random_state=42)
dss.fit(X)
S_est = dss.transform(X)
Running IterativeDSS with WienerMaskDenoiser...
3. Visualize Results and Biasing Function#
We compare the recovered source with the ground truth. We also visualize the mask that the denoiser would generate for the final component.
# Identify the burst component (highest correlation with envelope)
# Note: IterativeDSS returns components. We check which one is "bursty".
corrs = [np.corrcoef(np.abs(s), envelope)[0, 1] for s in S_est]
best_idx = np.argmax(corrs)
s_recovered = S_est[best_idx]
if np.corrcoef(s_recovered, s1)[0, 1] < 0:
    s_recovered *= -1

print(f"Best component: #{best_idx} (Corr with envelope: {corrs[best_idx]:.3f})")

window = 40
from scipy import ndimage

source_sq = s_recovered**2
local_mean_sq = ndimage.uniform_filter1d(source_sq, size=window, mode="reflect")
local_mean = ndimage.uniform_filter1d(s_recovered, size=window, mode="reflect")
local_var = np.maximum(local_mean_sq - local_mean**2, 0)
noise_var = np.percentile(local_var, 25)
signal_var = np.maximum(local_var - noise_var, 0)
mask = signal_var / (signal_var + noise_var + 1e-15)

# Plot
fig, axes = plt.subplots(4, 1, figsize=(10, 8), sharex=True)

# 1. Ground Truth
axes[0].plot(time, s1, "k")
axes[0].plot(time, envelope, "r--", label="Envelope")
axes[0].set_title("Ground Truth: Bursty 12Hz Signal")
axes[0].legend(loc="upper right")

# 2. Input Data (one channel)
axes[1].plot(time, X[0], "gray")
axes[1].set_title("Mixed Input (Channel 0)")

# 3. Recovered Source
axes[2].plot(time, s_recovered, "b")
axes[2].set_title(f"DSS Recovered Source (Component #{best_idx})")

# 4. Wiener Mask
axes[3].plot(time, mask, "g", lw=2)
axes[3].fill_between(time, 0, mask, color="g", alpha=0.2)
axes[3].set_title("Estimated Wiener Mask (Local Variance)")
axes[3].set_ylabel("Mask Value (0-1)")
axes[3].set_xlabel("Time (s)")

plt.tight_layout()
plt.show()

print("\nExample 11 Complete!")
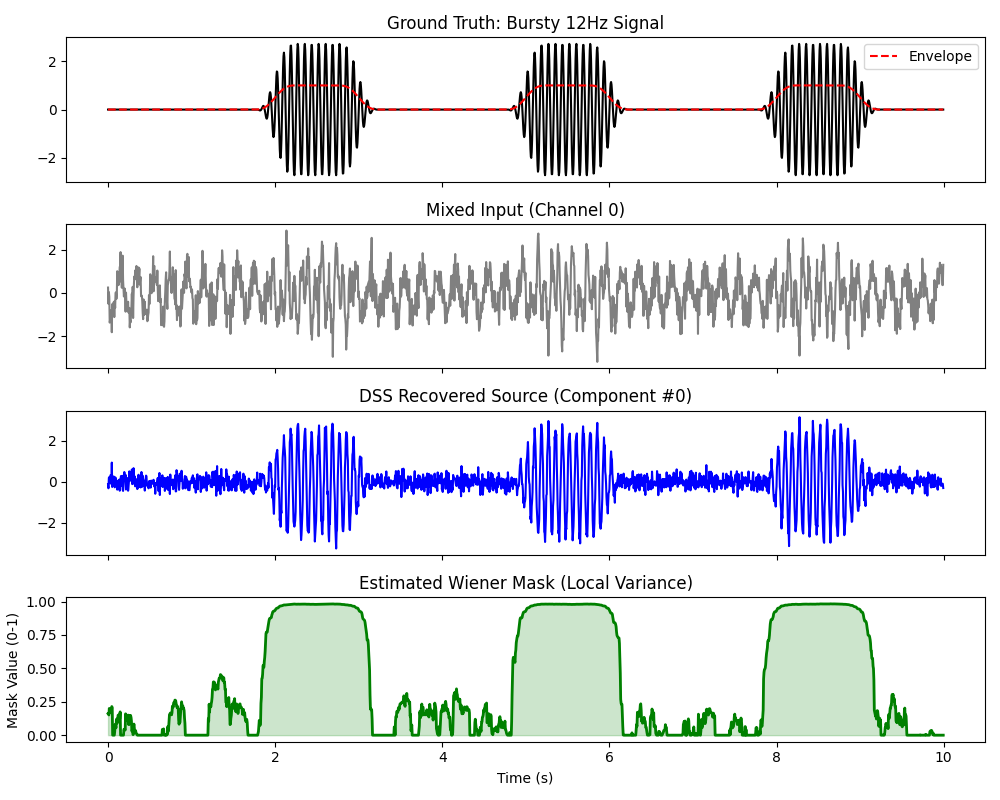
Best component: #0 (Corr with envelope: 0.811)

Example 11 Complete!
Total running time of the script: (0 minutes 0.300 seconds)