mne.viz.plot_dipole_amplitudes
- mne.viz.plot_dipole_amplitudes(dipoles, colors=None, show=True)[source]
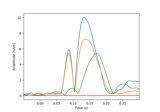
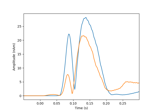
Plot the amplitude traces of a set of dipoles.
- Parameters
- Returns
- fig
matplotlib.figure.Figure The figure object containing the plot.
- fig
Notes
New in version 0.9.0.


