mne.Covariance
- class mne.Covariance(data, names, bads, projs, nfree, eig=None, eigvec=None, method=None, loglik=None, verbose=None)[source]
Noise covariance matrix.
Warning
This class should not be instantiated directly, but instead should be created using a covariance reading or computation function.
- Parameters
- dataarray_like
The data.
- names
listofstr Channel names.
- bads
listofstr Bad channels.
- projs
list Projection vectors.
- nfree
int Degrees of freedom.
- eigarray_like |
None Eigenvalues.
- eigvecarray_like |
None Eigenvectors.
- method
str|None The method used to compute the covariance.
- loglik
float The log likelihood.
- verbosebool,
str,int, orNone If not None, override default verbose level (see
mne.verbose()and Logging documentation for more). If used, it should be passed as a keyword-argument only. Defaults to self.verbose.
- Attributes
Methods
__add__(cov)Add Covariance taking into account number of degrees of freedom.
__contains__(key, /)True if the dictionary has the specified key, else False.
x.__getitem__(y) <==> x[y]
__iter__(/)Implement iter(self).
__len__(/)Return len(self).
as_diag()Set covariance to be processed as being diagonal.
clear()copy()Copy the Covariance object.
fromkeys(iterable[, value])Create a new dictionary with keys from iterable and values set to value.
get(key[, default])Return the value for key if key is in the dictionary, else default.
items()keys()pick_channels(ch_names[, ordered])Pick channels from this covariance matrix.
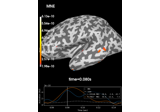
plot(info[, exclude, colorbar, proj, …])Plot Covariance data.
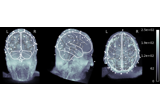
plot_topomap(info[, ch_type, vmin, vmax, …])Plot a topomap of the covariance diagonal.
pop(k[,d])If key is not found, d is returned if given, otherwise KeyError is raised
popitem(/)Remove and return a (key, value) pair as a 2-tuple.
save(fname)Save covariance matrix in a FIF file.
setdefault(key[, default])Insert key with a value of default if key is not in the dictionary.
update([E, ]**F)If E is present and has a .keys() method, then does: for k in E: D[k] = E[k] If E is present and lacks a .keys() method, then does: for k, v in E: D[k] = v In either case, this is followed by: for k in F: D[k] = F[k]
values()- __contains__(key, /)
True if the dictionary has the specified key, else False.
- __getitem__()
x.__getitem__(y) <==> x[y]
- __iter__(/)
Implement iter(self).
- __len__(/)
Return len(self).
- as_diag()[source]
Set covariance to be processed as being diagonal.
- Returns
- cov
dict The covariance.
- cov
Notes
This function allows creation of inverse operators equivalent to using the old “–diagnoise” mne option.
This function operates in place.
- property ch_names
Channel names.
- clear() None. Remove all items from D.
- copy()[source]
Copy the Covariance object.
- Returns
- covinstance of
Covariance The copied object.
- covinstance of
- property data
Numpy array of Noise covariance matrix.
- fromkeys(iterable, value=None, /)
Create a new dictionary with keys from iterable and values set to value.
- get(key, default=None, /)
Return the value for key if key is in the dictionary, else default.
- items() a set-like object providing a view on D’s items
- keys() a set-like object providing a view on D’s keys
- property nfree
Number of degrees of freedom.
- pick_channels(ch_names, ordered=False)[source]
Pick channels from this covariance matrix.
- Parameters
- Returns
- covinstance of Covariance.
The modified covariance matrix.
Notes
Operates in-place.
New in version 0.20.0.
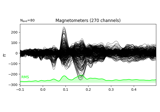
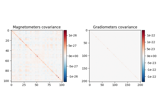
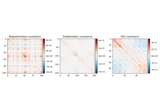
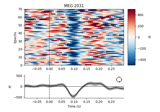
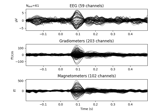
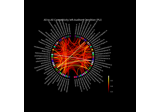
- plot(info, exclude=[], colorbar=True, proj=False, show_svd=True, show=True, verbose=None)[source]
Plot Covariance data.
- Parameters
- info
dict Measurement info.
- exclude
listofstr|str List of channels to exclude. If empty do not exclude any channel. If ‘bads’, exclude info[‘bads’].
- colorbarbool
Show colorbar or not.
- projbool
Apply projections or not.
- show_svdbool
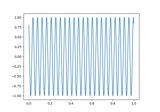
Plot also singular values of the noise covariance for each sensor type. We show square roots ie. standard deviations.
- showbool
Show figure if True.
- verbosebool,
str,int, orNone If not None, override default verbose level (see
mne.verbose()and Logging documentation for more). If used, it should be passed as a keyword-argument only.
- info
- Returns
- fig_covinstance of
matplotlib.figure.Figure The covariance plot.
- fig_svdinstance of
matplotlib.figure.Figure|None The SVD spectra plot of the covariance.
- fig_covinstance of
See also
Notes
For each channel type, the rank is estimated using
mne.compute_rank().Changed in version 0.19: Approximate ranks for each channel type are shown with red dashed lines.
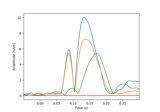
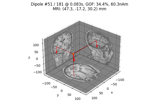
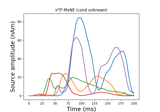
Examples using
plot:
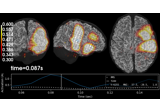
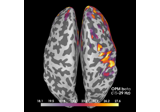
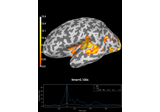
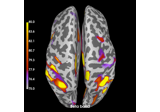
- plot_topomap(info, ch_type=None, vmin=None, vmax=None, cmap=None, sensors=True, colorbar=True, scalings=None, units=None, res=64, size=1, cbar_fmt='%3.1f', proj=False, show=True, show_names=False, title=None, mask=None, mask_params=None, outlines='head', contours=6, image_interp='bilinear', axes=None, extrapolate='auto', sphere=None, border='mean', noise_cov=None, verbose=None)[source]
Plot a topomap of the covariance diagonal.
- Parameters
- infoinstance of
Info The measurement information.
- ch_type
str The channel type being plotted. Determines the
'auto'extrapolation mode.New in version 0.21.
- vmin, vmax
float|callable()|None Lower and upper bounds of the colormap, in the same units as the data. If
vminandvmaxare bothNone, they are set at ± the maximum absolute value of the data (yielding a colormap with midpoint at 0). If only one ofvmin,vmaxisNone, will usemin(data)ormax(data), respectively. If callable, should accept aNumPy arrayof data and return a float.- cmapmatplotlib colormap | (colormap, bool) | ‘interactive’ |
None Colormap to use. If tuple, the first value indicates the colormap to use and the second value is a boolean defining interactivity. In interactive mode the colors are adjustable by clicking and dragging the colorbar with left and right mouse button. Left mouse button moves the scale up and down and right mouse button adjusts the range (zoom). The mouse scroll can also be used to adjust the range. Hitting space bar resets the range. Up and down arrows can be used to change the colormap. If None (default), ‘Reds’ is used for all positive data, otherwise defaults to ‘RdBu_r’. If ‘interactive’, translates to (None, True).
Warning
Interactive mode works smoothly only for a small amount of topomaps. Interactive mode is disabled by default for more than 2 topomaps.
- sensorsbool |
str Add markers for sensor locations to the plot. Accepts matplotlib plot format string (e.g., ‘r+’ for red plusses). If True (default), circles will be used.
- colorbarbool
Plot a colorbar in the rightmost column of the figure.
- scalings
dict|float|None The scalings of the channel types to be applied for plotting. If None, defaults to
dict(eeg=1e6, grad=1e13, mag=1e15).- units
dict|str|None The unit of the channel type used for colorbar label. If scale is None the unit is automatically determined.
- res
int The resolution of the topomap image (n pixels along each side).
- size
float Side length per topomap in inches.
- cbar_fmt
str String format for colorbar values.
- projbool | ‘interactive’ | ‘reconstruct’
If true SSP projections are applied before display. If ‘interactive’, a check box for reversible selection of SSP projection vectors will be shown. If ‘reconstruct’, projection vectors will be applied and then M/EEG data will be reconstructed via field mapping to reduce the signal bias caused by projection.
Changed in version 0.21: Support for ‘reconstruct’ was added.
- showbool
Show figure if True.
- show_namesbool |
callable() If True, show channel names on top of the map. If a callable is passed, channel names will be formatted using the callable; e.g., to delete the prefix ‘MEG ‘ from all channel names, pass the function
lambda x: x.replace('MEG ', ''). Ifmaskis not None, only significant sensors will be shown.- title
str|None Title. If None (default), no title is displayed.
- mask
ndarrayof bool, shape (n_channels, n_times) |None The channels to be marked as significant at a given time point. Indices set to
Truewill be considered. Defaults toNone.- mask_params
dict|None Additional plotting parameters for plotting significant sensors. Default (None) equals:
dict(marker='o', markerfacecolor='w', markeredgecolor='k',
        linewidth=0, markersize=4)
- outlines‘head’ | ‘skirt’ |
dict|None The outlines to be drawn. If ‘head’, the default head scheme will be drawn. If ‘skirt’ the head scheme will be drawn, but sensors are allowed to be plotted outside of the head circle. If dict, each key refers to a tuple of x and y positions, the values in ‘mask_pos’ will serve as image mask. Alternatively, a matplotlib patch object can be passed for advanced masking options, either directly or as a function that returns patches (required for multi-axis plots). If None, nothing will be drawn. Defaults to ‘head’.
- contours
int|arrayoffloat The number of contour lines to draw. If 0, no contours will be drawn. When an integer, matplotlib ticker locator is used to find suitable values for the contour thresholds (may sometimes be inaccurate, use array for accuracy). If an array, the values represent the levels for the contours. The values are in µV for EEG, fT for magnetometers and fT/m for gradiometers. If colorbar=True, the ticks in colorbar correspond to the contour levels. Defaults to 6.
- image_interp
str The image interpolation to be used. All matplotlib options are accepted.
- axesinstance of
Axes|list|None The axes to plot to. If list, the list must be a list of Axes of the same length as
times(unlesstimesis None). If instance of Axes,timesmust be a float or a list of one float. Defaults to None.- extrapolate
str Options:
'box'Extrapolate to four points placed to form a square encompassing all data points, where each side of the square is three times the range of the data in the respective dimension.
'local'(default)Extrapolate only to nearby points (approximately to points closer than median inter-electrode distance). This will also set the mask to be polygonal based on the convex hull of the sensors.
'head'Extrapolate out to the edges of the clipping circle. This will be on the head circle when the sensors are contained within the head circle, but it can extend beyond the head when sensors are plotted outside the head circle.
Changed in version 0.21:
The default was changed to
'local''local'was changed to use a convex hull mask'head'was changed to extrapolate out to the clipping circle.
- sphere
float| array_like |str|None The sphere parameters to use for the cartoon head. Can be array-like of shape (4,) to give the X/Y/Z origin and radius in meters, or a single float to give the radius (origin assumed 0, 0, 0). Can also be a spherical ConductorModel, which will use the origin and radius. Can be “auto” to use a digitization-based fit. Can also be None (default) to use ‘auto’ when enough extra digitization points are available, and 0.095 otherwise. Currently the head radius does not affect plotting.
New in version 0.20.
- border
float| ‘mean’ Value to extrapolate to on the topomap borders. If
'mean'(default), then each extrapolated point has the average value of its neighbours.New in version 0.20.
- noise_covinstance of
Covariance|None If not None, whiten the instance with
noise_covbefore plotting.- verbosebool,
str,int, orNone If not None, override default verbose level (see
mne.verbose()and Logging documentation for more). If used, it should be passed as a keyword-argument only.
- infoinstance of
- Returns
- figinstance of
Figure The matplotlib figure.
- figinstance of
Notes
New in version 0.21.
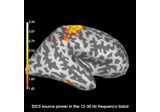
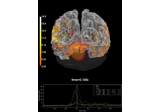
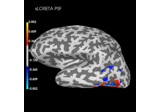
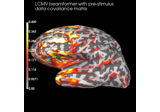
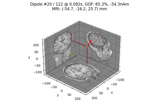
Examples using
plot_topomap:
- pop(k[, d]) v, remove specified key and return the corresponding value.
If key is not found, d is returned if given, otherwise KeyError is raised
- popitem(/)
Remove and return a (key, value) pair as a 2-tuple.
Pairs are returned in LIFO (last-in, first-out) order. Raises KeyError if the dict is empty.
- setdefault(key, default=None, /)
Insert key with a value of default if key is not in the dictionary.
Return the value for key if key is in the dictionary, else default.
- update([E, ]**F) None. Update D from dict/iterable E and F.
If E is present and has a .keys() method, then does: for k in E: D[k] = E[k] If E is present and lacks a .keys() method, then does: for k, v in E: D[k] = v In either case, this is followed by: for k in F: D[k] = F[k]
- values() an object providing a view on D’s values