mne.viz.plot_sensors_connectivity
- mne.viz.plot_sensors_connectivity(info, con, picks=None, cbar_label='Connectivity')[source]
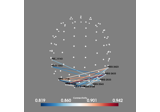
Visualize the sensor connectivity in 3D.
- Parameters
- info
dict|None The measurement info.
- con
array, shape (n_channels, n_channels) The computed connectivity measure(s).
- picks
str|list|slice|None Channels to include. Slices and lists of integers will be interpreted as channel indices. In lists, channel type strings (e.g.,
['meg', 'eeg']) will pick channels of those types, channel name strings (e.g.,['MEG0111', 'MEG2623']will pick the given channels. Can also be the string values “all” to pick all channels, or “data” to pick data channels. None (default) will pick good data channels. Note that channels ininfo['bads']will be included if their names or indices are explicitly provided. Indices of selected channels.- cbar_label
str Label for the colorbar.
- info
- Returns
- figinstance of
mayavi.mlab.Figure The mayavi figure.
- figinstance of