mne.viz.plot_projs_topomap
- mne.viz.plot_projs_topomap(projs, info, cmap=None, sensors=True, colorbar=False, res=64, size=1, show=True, outlines='head', contours=6, image_interp='bilinear', axes=None, vlim=(None, None), sphere=None, extrapolate='auto', border='mean')[source]
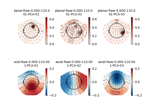
Plot topographic maps of SSP projections.
- Parameters
- projs
listofProjection The projections.
- infoinstance of
Info The info associated with the channels in the projectors.
Changed in version 0.20: The positional argument
layoutwas deprecated and replaced byinfo.- cmapmatplotlib colormap | (colormap, bool) | ‘interactive’ |
None Colormap to use. If tuple, the first value indicates the colormap to use and the second value is a boolean defining interactivity. In interactive mode (only works if
colorbar=True) the colors are adjustable by clicking and dragging the colorbar with left and right mouse button. Left mouse button moves the scale up and down and right mouse button adjusts the range. Hitting space bar resets the range. Up and down arrows can be used to change the colormap. If None (default), ‘Reds’ is used for all positive data, otherwise defaults to ‘RdBu_r’. If ‘interactive’, translates to (None, True).- sensorsbool |
str Add markers for sensor locations to the plot. Accepts matplotlib plot format string (e.g., ‘r+’ for red plusses). If True, a circle will be used (via .add_artist). Defaults to True.
- colorbarbool
Plot a colorbar.
- res
int The resolution of the topomap image (n pixels along each side).
- sizescalar
Side length of the topomaps in inches (only applies when plotting multiple topomaps at a time).
- showbool
Show figure if True.
- outlines‘head’ | ‘skirt’ |
dict|None The outlines to be drawn. If ‘head’, the default head scheme will be drawn. If ‘skirt’ the head scheme will be drawn, but sensors are allowed to be plotted outside of the head circle. If dict, each key refers to a tuple of x and y positions, the values in ‘mask_pos’ will serve as image mask. Alternatively, a matplotlib patch object can be passed for advanced masking options, either directly or as a function that returns patches (required for multi-axis plots). If None, nothing will be drawn. Defaults to ‘head’.
- contours
int|arrayoffloat The number of contour lines to draw. If 0, no contours will be drawn. When an integer, matplotlib ticker locator is used to find suitable values for the contour thresholds (may sometimes be inaccurate, use array for accuracy). If an array, the values represent the levels for the contours. Defaults to 6.
- image_interp
str The image interpolation to be used. All matplotlib options are accepted.
- axesinstance of
Axes|list|None The axes to plot to. If list, the list must be a list of Axes of the same length as the number of projectors. If instance of Axes, there must be only one projector. Defaults to None.
- vlim
tupleof length 2 | ‘joint’ Colormap limits to use. If
tuple, specifies the lower and upper bounds of the colormap (in that order); providingNonefor either of these will set the corresponding boundary at the min/max of the data (separately for each projector). The keyword value'joint'will compute the colormap limits jointly across all provided projectors of the same channel type, using the min/max of the projector data. If vlim is'joint',infomust not beNone. Defaults to(None, None).- sphere
float| array_like |str|None The sphere parameters to use for the cartoon head. Can be array-like of shape (4,) to give the X/Y/Z origin and radius in meters, or a single float to give the radius (origin assumed 0, 0, 0). Can also be a spherical ConductorModel, which will use the origin and radius. Can be “auto” to use a digitization-based fit. Can also be None (default) to use ‘auto’ when enough extra digitization points are available, and 0.095 otherwise. Currently the head radius does not affect plotting.
New in version 0.20.
- extrapolate
str Options:
'box'Extrapolate to four points placed to form a square encompassing all data points, where each side of the square is three times the range of the data in the respective dimension.
'local'(default)Extrapolate only to nearby points (approximately to points closer than median inter-electrode distance). This will also set the mask to be polygonal based on the convex hull of the sensors.
'head'Extrapolate out to the edges of the clipping circle. This will be on the head circle when the sensors are contained within the head circle, but it can extend beyond the head when sensors are plotted outside the head circle.
Changed in version 0.21:
The default was changed to
'local''local'was changed to use a convex hull mask'head'was changed to extrapolate out to the clipping circle.
New in version 0.20.
- border
float| ‘mean’ Value to extrapolate to on the topomap borders. If
'mean'(default), then each extrapolated point has the average value of its neighbours.New in version 0.20.
- projs
- Returns
- figinstance of
matplotlib.figure.Figure Figure with a topomap subplot for each projector.
- figinstance of
Notes
New in version 0.9.0.