Note
Go to the end to download the full example code.
Analysis of evoked response using ICA and PCA reduction techniques#
This example computes PCA and ICA of evoked or epochs data. Then the PCA / ICA components, a.k.a. spatial filters, are used to transform the channel data to new sources / virtual channels. The output is visualized on the average of all the epochs.
# Authors: Jean-Rémi King <jeanremi.king@gmail.com>
#          Asish Panda <asishrocks95@gmail.com>
#
# License: BSD-3-Clause
# Copyright the MNE-Python contributors.
import matplotlib.pyplot as plt
import numpy as np
from sklearn.decomposition import PCA, FastICA

import mne
from mne.datasets import sample
from mne.decoding import UnsupervisedSpatialFilter

print(__doc__)

# Preprocess data
data_path = sample.data_path()

# Load and filter data, set up epochs
meg_path = data_path / "MEG" / "sample"
raw_fname = meg_path / "sample_audvis_filt-0-40_raw.fif"
event_fname = meg_path / "sample_audvis_filt-0-40_raw-eve.fif"
tmin, tmax = -0.1, 0.3
event_id = dict(aud_l=1, aud_r=2, vis_l=3, vis_r=4)

raw = mne.io.read_raw_fif(raw_fname, preload=True)
raw.filter(1, 20, fir_design="firwin")
events = mne.read_events(event_fname)

picks = mne.pick_types(
    raw.info, meg=False, eeg=True, stim=False, eog=False, exclude="bads"
)

epochs = mne.Epochs(
    raw,
    events,
    event_id,
    tmin,
    tmax,
    proj=False,
    picks=picks,
    baseline=None,
    preload=True,
    verbose=False,
)

X = epochs.get_data(copy=False)
Opening raw data file /home/circleci/mne_data/MNE-sample-data/MEG/sample/sample_audvis_filt-0-40_raw.fif...
    Read a total of 4 projection items:
        PCA-v1 (1 x 10²)  idle
        PCA-v2 (1 x 10²)  idle
        PCA-v3 (1 x 10²)  idle
        Average EEG reference (1 x 60)  idle
    Range : 6450 ... 48149 =     42.956 ...   320.665 secs
Ready.
Reading 0 ... 41699  =      0.000 ...   277.709 secs...
Filtering raw data in 1 contiguous segment
Setting up band-pass filter from 1 - 20 Hz

FIR filter parameters
---------------------
Designing a one-pass, zero-phase, non-causal bandpass filter:
- Windowed time-domain design (firwin) method
- Hamming window with 0.0194 passband ripple and 53 dB stopband attenuation
- Lower passband edge: 1.00
- Lower transition bandwidth: 1.00 Hz (-6 dB cutoff frequency: 0.50 Hz)
- Upper passband edge: 20.00 Hz
- Upper transition bandwidth: 5.00 Hz (-6 dB cutoff frequency: 22.50 Hz)
- Filter length: 497 samples (3.310 s)
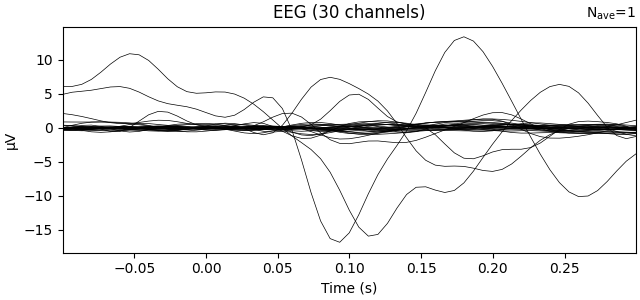
Transform data with PCA computed on the average ie evoked response
pca = UnsupervisedSpatialFilter(PCA(30), average=False)
pca_data = pca.fit_transform(X)
ev = mne.EvokedArray(
    np.mean(pca_data, axis=0),
    mne.create_info(30, epochs.info["sfreq"], ch_types="eeg"),
    tmin=tmin,
)
ev.plot(show=False, window_title="PCA", time_unit="s")
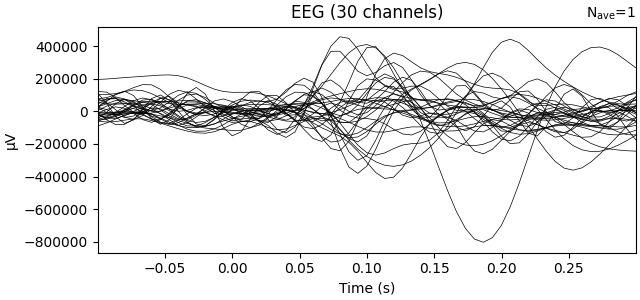
Transform data with ICA computed on the raw epochs (no averaging)
ica = UnsupervisedSpatialFilter(FastICA(30, whiten="unit-variance"), average=False)
ica_data = ica.fit_transform(X)
ev1 = mne.EvokedArray(
    np.mean(ica_data, axis=0),
    mne.create_info(30, epochs.info["sfreq"], ch_types="eeg"),
    tmin=tmin,
)
ev1.plot(show=False, window_title="ICA", time_unit="s")

plt.show()
Total running time of the script: (0 minutes 3.064 seconds)