
Note
Go to the end to download the full example code.
XDAWN Denoising#
XDAWN filters are trained from epochs, signal is projected in the sources space and then projected back in the sensor space using only the first two XDAWN components. The process is similar to an ICA, but is supervised in order to maximize the signal to signal + noise ratio of the evoked response [1][2].
Warning
As this denoising method exploits the known events to maximize SNR of the contrast between conditions it can lead to overfitting. To avoid a statistical analysis problem you should split epochs used in fit with the ones used in apply method.
# Authors: Alexandre Barachant <alexandre.barachant@gmail.com>
#
# License: BSD-3-Clause
# Copyright the MNE-Python contributors.
from mne import Epochs, compute_raw_covariance, io, pick_types, read_events
from mne.datasets import sample
from mne.preprocessing import Xdawn
from mne.viz import plot_epochs_image

print(__doc__)

data_path = sample.data_path()
Set parameters and read data
meg_path = data_path / "MEG" / "sample"
raw_fname = meg_path / "sample_audvis_filt-0-40_raw.fif"
event_fname = meg_path / "sample_audvis_filt-0-40_raw-eve.fif"
tmin, tmax = -0.1, 0.3
event_id = dict(vis_r=4)

# Setup for reading the raw data
raw = io.read_raw_fif(raw_fname, preload=True)
raw.filter(1, 20, fir_design="firwin")  # replace baselining with high-pass
events = read_events(event_fname)

raw.info["bads"] = ["MEG 2443"]  # set bad channels
picks = pick_types(raw.info, meg=True, eeg=False, stim=False, eog=False, exclude="bads")
# Epoching, applying the SSP projectors that come with this dataset
raw.apply_proj()
epochs = Epochs(
    raw,
    events,
    event_id,
    tmin,
    tmax,
    proj=True,
    picks=picks,
    baseline=None,
    preload=True,
    verbose=False,
)

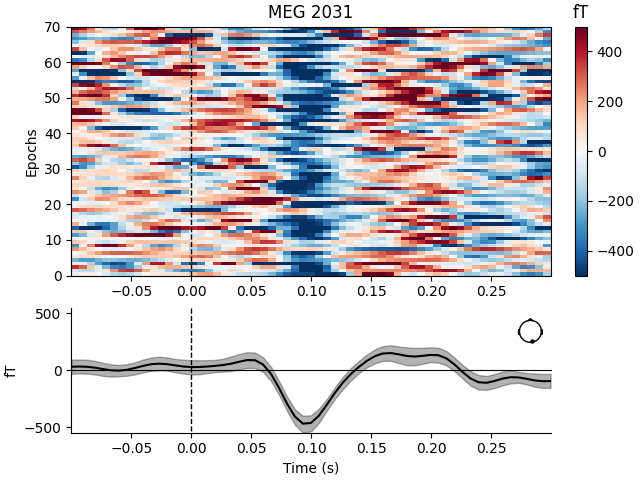
# Plot image epoch before xdawn
plot_epochs_image(epochs["vis_r"], picks=[230], vmin=-500, vmax=500)
Opening raw data file /home/circleci/mne_data/MNE-sample-data/MEG/sample/sample_audvis_filt-0-40_raw.fif...
    Read a total of 4 projection items:
        PCA-v1 (1 x 10²)  idle
        PCA-v2 (1 x 10²)  idle
        PCA-v3 (1 x 10²)  idle
        Average EEG reference (1 x 60)  idle
    Range : 6450 ... 48149 =     42.956 ...   320.665 secs
Ready.
Reading 0 ... 41699  =      0.000 ...   277.709 secs...
Filtering raw data in 1 contiguous segment
Setting up band-pass filter from 1 - 20 Hz

FIR filter parameters
---------------------
Designing a one-pass, zero-phase, non-causal bandpass filter:
- Windowed time-domain design (firwin) method
- Hamming window with 0.0194 passband ripple and 53 dB stopband attenuation
- Lower passband edge: 1.00
- Lower transition bandwidth: 1.00 Hz (-6 dB cutoff frequency: 0.50 Hz)
- Upper passband edge: 20.00 Hz
- Upper transition bandwidth: 5.00 Hz (-6 dB cutoff frequency: 22.50 Hz)
- Filter length: 497 samples (3.310 s)

Created an SSP operator (subspace dimension = 4)
4 projection items activated
SSP projectors applied...
Not setting metadata
70 matching events found
No baseline correction applied
0 projection items activated
Now, we estimate a set of xDAWN filters for the epochs (which contain only
the vis_r class).
Applying the three SSP projectors above makes the data rank deficient (302
instead of 305), so the generalized eigenvalue decomposition that xDAWN
relies on is ill-conditioned (and can fail outright) unless we tell it about
the rank of the data. Passing rank="info" restricts the decomposition to
the 302-dimensional principal subspace of the signal covariance and projects
the resulting filters and patterns back out to the 305 sensors.
# Estimates signal covariance
signal_cov = compute_raw_covariance(raw, picks=picks)

# Xdawn instance
xd = Xdawn(n_components=2, signal_cov=signal_cov, rank="info")

# Fit xdawn
xd.fit(epochs)
Using up to 1388 segments
Number of samples used : 41640
[done]
Computing rank from data with rank='info'
    data: rank 302 after 3 projectors applied to 305 channels
    Created an SSP operator (subspace dimension = 3)
    Setting small data eigenvalues to zero (without PCA)
Estimating covariance using EMPIRICAL
Done.
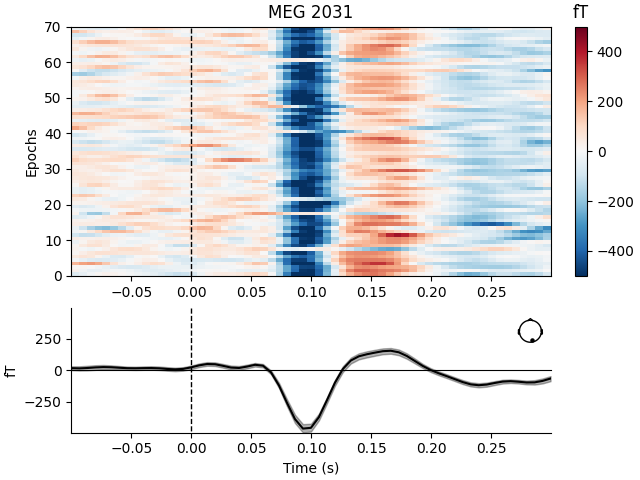
Epochs are denoised by calling apply, which by default keeps only the
signal subspace corresponding to the first n_components specified in the
Xdawn constructor above.
epochs_denoised = xd.apply(epochs)

# Plot image epoch after Xdawn
plot_epochs_image(epochs_denoised["vis_r"], picks=[230], vmin=-500, vmax=500)
Transforming to Xdawn space
Zeroing out 300 Xdawn components
Inverse transforming to sensor space
Not setting metadata
70 matching events found
No baseline correction applied
0 projection items activated
References#
Total running time of the script: (0 minutes 2.115 seconds)