Note
Go to the end to download the full example code.
Non-parametric between conditions cluster statistic on single trial power#
This script shows how to compare clusters in time-frequency power estimates between conditions. It uses a non-parametric statistical procedure based on permutations and cluster level statistics.
The procedure consists of:
extracting epochs for 2 conditions
compute single trial power estimates
baseline line correct the power estimates (power ratios)
compute stats to see if the power estimates are significantly different between conditions.
# Authors: Alexandre Gramfort <alexandre.gramfort@inria.fr>
#
# License: BSD-3-Clause
# Copyright the MNE-Python contributors.
import matplotlib.pyplot as plt
import numpy as np

import mne
from mne.datasets import sample
from mne.stats import permutation_cluster_test

print(__doc__)
Set parameters
data_path = sample.data_path()
meg_path = data_path / "MEG" / "sample"
raw_fname = meg_path / "sample_audvis_raw.fif"
event_fname = meg_path / "sample_audvis_raw-eve.fif"
tmin, tmax = -0.2, 0.5

# Setup for reading the raw data
raw = mne.io.read_raw_fif(raw_fname)
events = mne.read_events(event_fname)

include = []
raw.info["bads"] += ["MEG 2443", "EEG 053"]  # bads + 2 more

# picks MEG gradiometers
picks = mne.pick_types(
    raw.info,
    meg="grad",
    eeg=False,
    eog=True,
    stim=False,
    include=include,
    exclude="bads",
)

ch_name = "MEG 1332"  # restrict example to one channel

# Load condition 1
reject = dict(grad=4000e-13, eog=150e-6)
event_id = 1
epochs_condition_1 = mne.Epochs(
    raw,
    events,
    event_id,
    tmin,
    tmax,
    picks=picks,
    baseline=(None, 0),
    reject=reject,
    preload=True,
)
epochs_condition_1.pick([ch_name])

# Load condition 2
event_id = 2
epochs_condition_2 = mne.Epochs(
    raw,
    events,
    event_id,
    tmin,
    tmax,
    picks=picks,
    baseline=(None, 0),
    reject=reject,
    preload=True,
)
epochs_condition_2.pick([ch_name])
Opening raw data file /home/circleci/mne_data/MNE-sample-data/MEG/sample/sample_audvis_raw.fif...
    Read a total of 3 projection items:
        PCA-v1 (1 x 10²)  idle
        PCA-v2 (1 x 10²)  idle
        PCA-v3 (1 x 10²)  idle
    Range : 25800 ... 192599 =     42.956 ...   320.670 secs
Ready.
Not setting metadata
72 matching events found
Setting baseline interval to [-0.19979521315838786, 0.0] s
Applying baseline correction (mode: mean)
0 projection items activated
Loading data for 72 events and 421 original time points ...
    Rejecting  epoch based on EOG : ['EOG 061']
    Rejecting  epoch based on EOG : ['EOG 061']
    Rejecting  epoch based on EOG : ['EOG 061']
    Rejecting  epoch based on EOG : ['EOG 061']
    Rejecting  epoch based on EOG : ['EOG 061']
    Rejecting  epoch based on EOG : ['EOG 061']
    Rejecting  epoch based on EOG : ['EOG 061']
    Rejecting  epoch based on EOG : ['EOG 061']
    Rejecting  epoch based on EOG : ['EOG 061']
    Rejecting  epoch based on EOG : ['EOG 061']
    Rejecting  epoch based on EOG : ['EOG 061']
    Rejecting  epoch based on EOG : ['EOG 061']
    Rejecting  epoch based on EOG : ['EOG 061']
    Rejecting  epoch based on EOG : ['EOG 061']
    Rejecting  epoch based on EOG : ['EOG 061']
    Rejecting  epoch based on EOG : ['EOG 061']
16 bad epochs dropped
Not setting metadata
73 matching events found
Setting baseline interval to [-0.19979521315838786, 0.0] s
Applying baseline correction (mode: mean)
0 projection items activated
Loading data for 73 events and 421 original time points ...
    Rejecting  epoch based on EOG : ['EOG 061']
    Rejecting  epoch based on EOG : ['EOG 061']
    Rejecting  epoch based on EOG : ['EOG 061']
    Rejecting  epoch based on EOG : ['EOG 061']
    Rejecting  epoch based on EOG : ['EOG 061']
    Rejecting  epoch based on EOG : ['EOG 061']
    Rejecting  epoch based on EOG : ['EOG 061']
    Rejecting  epoch based on EOG : ['EOG 061']
    Rejecting  epoch based on EOG : ['EOG 061']
    Rejecting  epoch based on EOG : ['EOG 061']
    Rejecting  epoch based on EOG : ['EOG 061']
    Rejecting  epoch based on EOG : ['EOG 061']
    Rejecting  epoch based on EOG : ['EOG 061']
13 bad epochs dropped
Factor to downsample the temporal dimension of the TFR computed by tfr_morlet. Decimation occurs after frequency decomposition and can be used to reduce memory usage (and possibly comptuational time of downstream operations such as nonparametric statistics) if you don’t need high spectrotemporal resolution.
decim = 2
freqs = np.arange(7, 30, 3)  # define frequencies of interest
n_cycles = 1.5
tfr_kwargs = dict(
    method="morlet",
    freqs=freqs,
    n_cycles=n_cycles,
    decim=decim,
    return_itc=False,
    average=False,
)

tfr_epochs_1 = epochs_condition_1.compute_tfr(**tfr_kwargs)
tfr_epochs_2 = epochs_condition_2.compute_tfr(**tfr_kwargs)

tfr_epochs_1.apply_baseline(mode="ratio", baseline=(None, 0))
tfr_epochs_2.apply_baseline(mode="ratio", baseline=(None, 0))

epochs_power_1 = tfr_epochs_1.data[:, 0, :, :]  # only 1 channel as 3D matrix
epochs_power_2 = tfr_epochs_2.data[:, 0, :, :]  # only 1 channel as 3D matrix
Applying baseline correction (mode: ratio)
Applying baseline correction (mode: ratio)
Compute statistic#
threshold = 6.0
F_obs, clusters, cluster_p_values, H0 = permutation_cluster_test(
    [epochs_power_1, epochs_power_2],
    out_type="mask",
    n_permutations=100,
    threshold=threshold,
    tail=0,
    seed=np.random.default_rng(seed=8675309),
)
stat_fun(H1): min=1.6034294645049068e-08 max=13.566823828074961
Running initial clustering …
Found 6 clusters

  0%|          | Permuting : 0/99 [00:00<?,       ?it/s]
 34%|███▍      | Permuting : 34/99 [00:00<00:00,  985.03it/s]
 69%|██████▊   | Permuting : 68/99 [00:00<00:00,  996.93it/s]
100%|██████████| Permuting : 99/99 [00:00<00:00, 1006.54it/s]
100%|██████████| Permuting : 99/99 [00:00<00:00, 1003.31it/s]
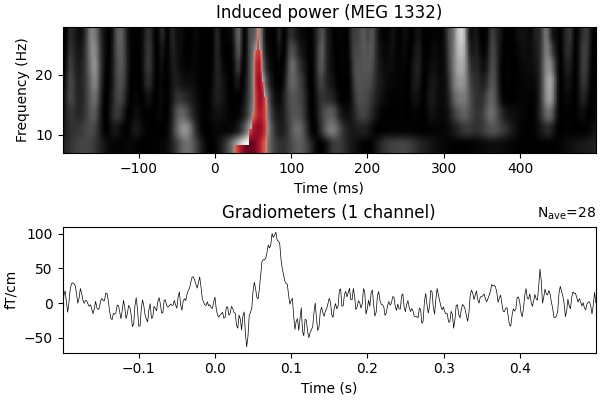
View time-frequency plots#
times = 1e3 * epochs_condition_1.times  # change unit to ms

fig, (ax, ax2) = plt.subplots(2, 1, figsize=(6, 4), layout="constrained")

# Compute the difference in evoked to determine which was greater since
# we used a 1-way ANOVA which tested for a difference in population means
evoked_power_1 = epochs_power_1.mean(axis=0)
evoked_power_2 = epochs_power_2.mean(axis=0)
evoked_power_contrast = evoked_power_1 - evoked_power_2
signs = np.sign(evoked_power_contrast)

# Create new stats image with only significant clusters
F_obs_plot = np.nan * np.ones_like(F_obs)
for c, p_val in zip(clusters, cluster_p_values):
    if p_val <= 0.05:
        F_obs_plot[c] = F_obs[c] * signs[c]

ax.imshow(
    F_obs,
    extent=[times[0], times[-1], freqs[0], freqs[-1]],
    aspect="auto",
    origin="lower",
    cmap="gray",
)
max_F = np.nanmax(abs(F_obs_plot))
ax.imshow(
    F_obs_plot,
    extent=[times[0], times[-1], freqs[0], freqs[-1]],
    aspect="auto",
    origin="lower",
    cmap="RdBu_r",
    vmin=-max_F,
    vmax=max_F,
)

ax.set_xlabel("Time (ms)")
ax.set_ylabel("Frequency (Hz)")
ax.set_title(f"Induced power ({ch_name})")

# plot evoked
evoked_condition_1 = epochs_condition_1.average()
evoked_condition_2 = epochs_condition_2.average()
evoked_contrast = mne.combine_evoked(
    [evoked_condition_1, evoked_condition_2], weights=[1, -1]
)
evoked_contrast.plot(axes=ax2, time_unit="s")

Need more than one channel to make topography for grad. Disabling interactivity.
Total running time of the script: (0 minutes 1.707 seconds)