Note
Go to the end to download the full example code.
Spectrum Interpolation: Power-Line Noise Removal.#
This example demonstrates SpectrumInterpolation
on a synthetic recording contaminated by 60 Hz line noise and its harmonics.
Spectrum interpolation removes the line frequency by replacing the amplitude of a thin band around it (and its harmonics) with the mean amplitude of the neighbouring bins, while keeping the phase unchanged. Compared with a notch filter, this edits only a narrow amplitude band and leaves the broadband spectrum and phase intact.
- Reference:
Leske, S., & Dalal, S. S. (2019). Reducing power line noise in EEG and MEG data via spectrum interpolation. NeuroImage, 189, 763-776.
- Authors: Sina Esmaeili (sina.esmaeili@umontreal.ca)
Hamza Abdelhedi (hamza.abdelhedi@umontreal.ca)
Imports#
import matplotlib.pyplot as plt
import numpy as np
from scipy import signal

from mne_denoise.spectrum_interpolation import SpectrumInterpolation
Synthetic data#
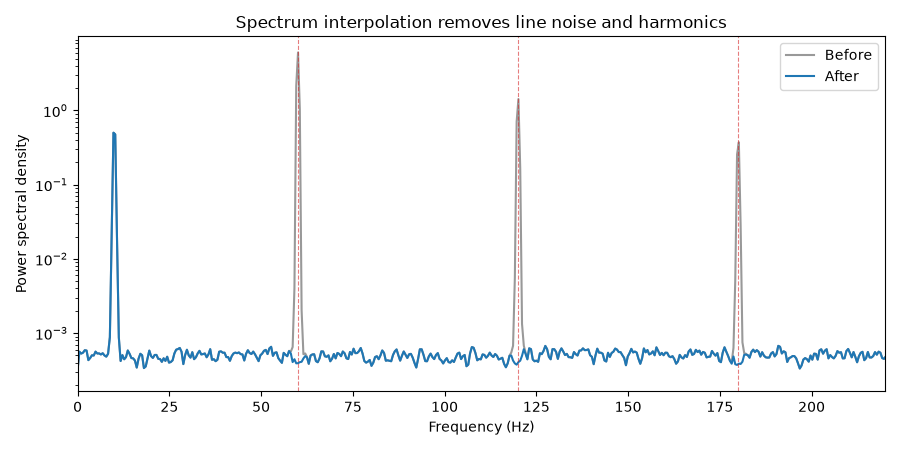
We build an 8-channel, 10-second recording that contains a 10 Hz oscillation we want to keep, strong 60 Hz line noise with 120 and 180 Hz harmonics, and broadband background noise.
sfreq = 1000.0
duration = 10.0
n_channels = 8
n_times = int(sfreq * duration)
t = np.arange(n_times) / sfreq

rng = np.random.default_rng(42)
neural = np.sin(2 * np.pi * 10 * t)

data = rng.standard_normal((n_channels, n_times)) * 0.5
data += neural[None, :]
for harmonic, amplitude in [(60.0, 3.0), (120.0, 1.5), (180.0, 0.8)]:
    data += amplitude * np.sin(2 * np.pi * harmonic * t)[None, :]
Apply spectrum interpolation#
The estimator follows the scikit-learn fit / transform API. We target
60 Hz and remove all of its harmonics below the Nyquist frequency. Spectrum
interpolation is best suited to continuous recordings or long segments;
inspect short epochs for edge effects.
Targeted frequencies (Hz): [ 60. 120. 180. 240. 300. 360. 420. 480.]
Compare power spectra#
The line frequency and its harmonics drop to the noise floor, while the 10 Hz peak and the surrounding broadband spectrum are preserved.
freqs, psd_before = signal.welch(data, fs=sfreq, nperseg=2048)
_, psd_after = signal.welch(clean, fs=sfreq, nperseg=2048)

fig, ax = plt.subplots(figsize=(9, 4.5))
ax.semilogy(freqs, psd_before.mean(0), label="Before", color="0.6")
ax.semilogy(freqs, psd_after.mean(0), label="After", color="C0")
for harmonic in (60.0, 120.0, 180.0):
    ax.axvline(harmonic, color="C3", ls="--", lw=0.8, alpha=0.6)
ax.set_xlim(0, 220)
ax.set_xlabel("Frequency (Hz)")
ax.set_ylabel("Power spectral density")
ax.set_title("Spectrum interpolation removes line noise and harmonics")
ax.legend()
fig.tight_layout()
Total running time of the script: (0 minutes 0.235 seconds)