Note
Go to the end to download the full example code.
Basic SSA decomposition and frequency-guided cleaning#
This network-free example separates a slow synthetic drift from an alpha rhythm. The frequency grouping is an mne-denoise extension, not a grouping rule prescribed by Basic SSA.
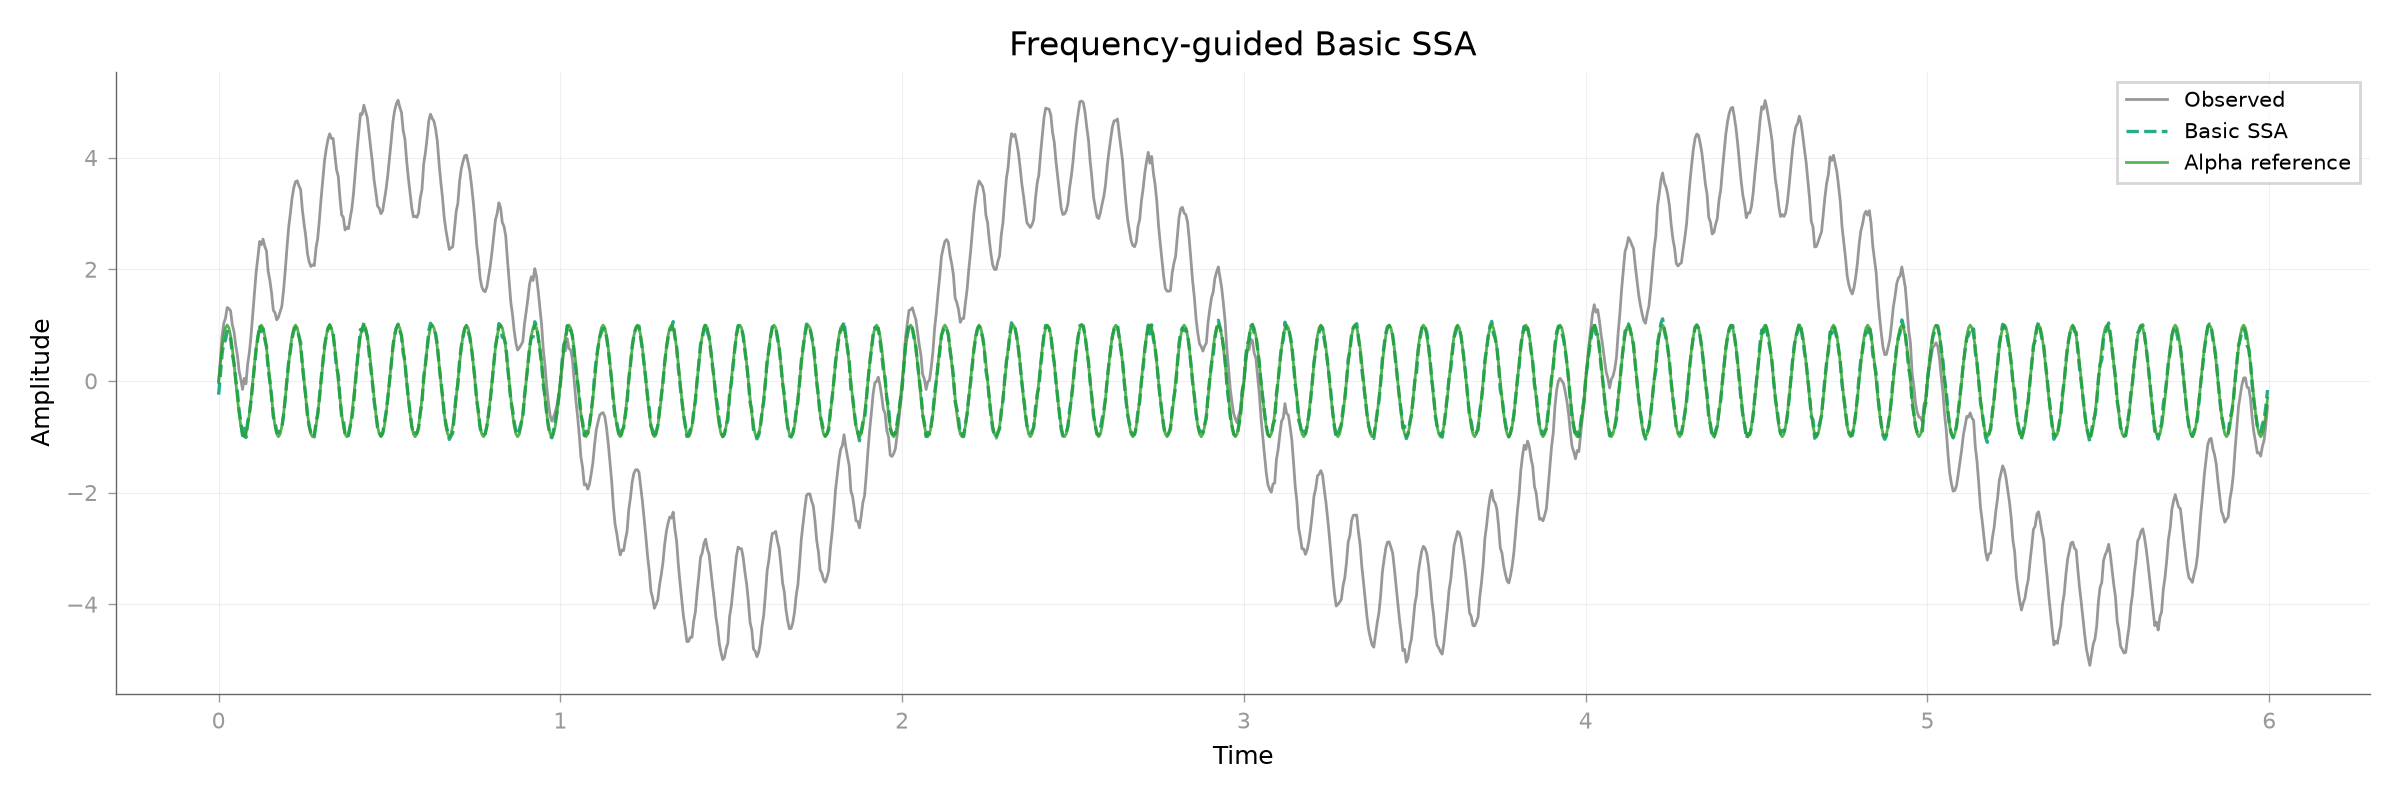
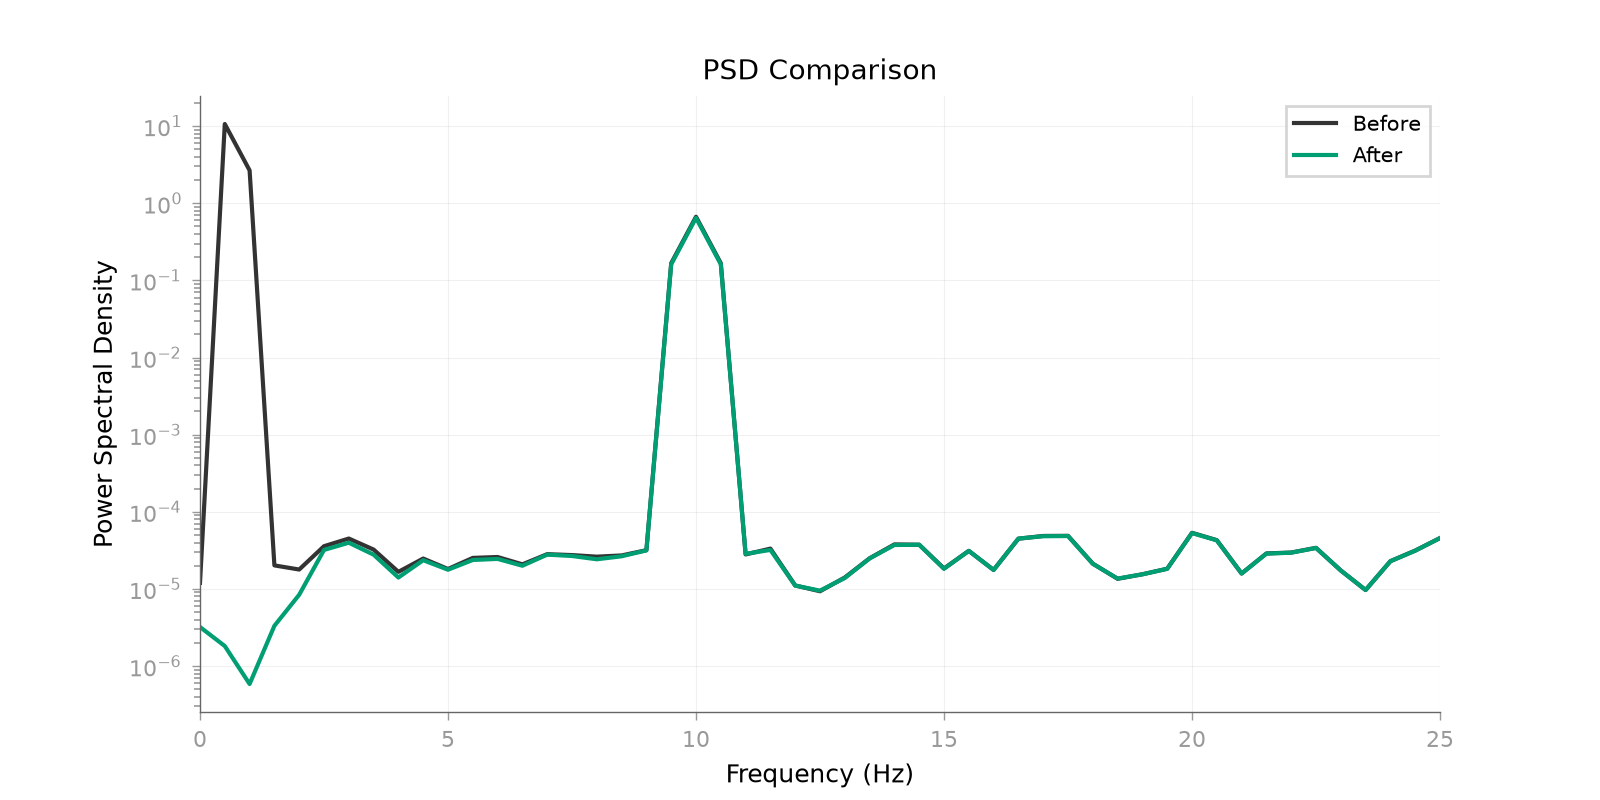
Additive reconstruction error: 2.520e-14
Dropped frequencies: [0.5 0.5]

<Figure size 1600x800 with 1 Axes>
import numpy as np

from mne_denoise.ssa import SingularSpectrumAnalysis, ssa_decompose
from mne_denoise.viz import plot_psd_comparison, plot_signal_overlay

sfreq = 200.0
times = np.arange(1200) / sfreq
alpha = np.sin(2 * np.pi * 10.0 * times)
drift = 4.0 * np.sin(2 * np.pi * 0.5 * times)
rng = np.random.default_rng(4)
observed = drift + alpha + 0.05 * rng.standard_normal(times.size)

components, info = ssa_decompose(observed, window_seconds=0.5, sfreq=sfreq)
reconstruction_error = np.max(np.abs(components.sum(axis=0) - observed))
print(f"Additive reconstruction error: {reconstruction_error:.3e}")

cleaner = SingularSpectrumAnalysis(
    sfreq=sfreq,
    window_seconds=0.5,
    drop_freq_max=3.0,
)
cleaned = cleaner.fit_transform(observed[np.newaxis])[0]
print(f"Dropped frequencies: {cleaner.dropped_frequencies_[0]}")

plot_signal_overlay(
    observed,
    cleaned,
    times,
    reference=alpha,
    before_label="Observed",
    after_label="Basic SSA",
    reference_label="Alpha reference",
    scale_after=False,
    title="Frequency-guided Basic SSA",
    show=False,
)
plot_psd_comparison(
    observed,
    cleaned,
    sfreq=sfreq,
    fmin=0,
    fmax=25,
    show=False,
)
Total running time of the script: (0 minutes 0.581 seconds)