mne.Dipole#
- class mne.Dipole(times, pos, amplitude, ori, gof, name=None, conf=None, khi2=None, nfree=None, *, verbose=None)[source]#
Dipole class for sequential dipole fits.
Note
This class should usually not be instantiated directly, instead
mne.read_dipole()should be used.Used to store positions, orientations, amplitudes, times, goodness of fit of dipoles, typically obtained with Neuromag/xfit, mne_dipole_fit or certain inverse solvers. Note that dipole position vectors are given in the head coordinate frame.
- Parameters:
- times
array, shape (n_dipoles,) The time instants at which each dipole was fitted (sec).
- pos
array, shape (n_dipoles, 3) The dipoles positions (m) in head coordinates.
- amplitude
array, shape (n_dipoles,) The amplitude of the dipoles (Am).
- ori
array, shape (n_dipoles, 3) The dipole orientations (normalized to unit length).
- gof
array, shape (n_dipoles,) The goodness of fit.
- name
str|None Name of the dipole.
- conf
dict Confidence limits in dipole orientation for “vol” in m^3 (volume), “depth” in m (along the depth axis), “long” in m (longitudinal axis), “trans” in m (transverse axis), “qlong” in Am, and “qtrans” in Am (currents). The current confidence limit in the depth direction is assumed to be zero (although it can be non-zero when a BEM is used).
New in version 0.15.
- khi2
array, shape (n_dipoles,) The χ^2 values for the fits.
New in version 0.15.
- nfree
array, shape (n_dipoles,) The number of free parameters for each fit.
New in version 0.15.
- verbosebool |
str|int|None Control verbosity of the logging output. If
None, use the default verbosity level. See the logging documentation andmne.verbose()for details. Should only be passed as a keyword argument.
- times
See also
Notes
This class is for sequential dipole fits, where the position changes as a function of time. For fixed dipole fits, where the position is fixed as a function of time, use
mne.DipoleFixed.Methods
__getitem__(item)Get a time slice.
__len__()Return the number of dipoles.
copy()Copy the Dipoles object.
crop([tmin, tmax, include_tmax, verbose])Crop data to a given time interval.
decimate(decim[, offset, verbose])Decimate the time-series data.
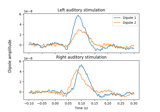
plot_amplitudes([color, show])Plot the dipole amplitudes as a function of time.
plot_locations(trans, subject[, ...])Plot dipole locations.
save(fname[, overwrite, verbose])Save dipole in a .dip or .bdip file.
shift_time(tshift[, relative])Shift time scale in epoched or evoked data.
time_as_index(times[, use_rounding])Convert time to indices.
to_mni(subject, trans[, subjects_dir, verbose])Convert dipole location from head to MNI coordinates.
to_mri(subject, trans[, subjects_dir, verbose])Convert dipole location from head to MRI surface RAS coordinates.
to_volume_labels(trans[, subject, aseg, ...])Find an ROI in atlas for the dipole positions.
- __getitem__(item)[source]#
Get a time slice.
- Parameters:
- itemarray-like or
slice The slice of time points to use.
- itemarray-like or
- Returns:
- dipinstance of
Dipole The sliced dipole.
- dipinstance of
- __len__()[source]#
Return the number of dipoles.
- Returns:
- len
int The number of dipoles.
- len
Examples
This can be used as:
>>> len(dipoles)
10
- crop(tmin=None, tmax=None, include_tmax=True, verbose=None)[source]#
Crop data to a given time interval.
- Parameters:
- tmin
float|None Start time of selection in seconds.
- tmax
float|None End time of selection in seconds.
- include_tmaxbool
If True (default), include tmax. If False, exclude tmax (similar to how Python indexing typically works).
New in version 0.19.
- verbosebool |
str|int|None Control verbosity of the logging output. If
None, use the default verbosity level. See the logging documentation andmne.verbose()for details. Should only be passed as a keyword argument.
- tmin
- Returns:
- selfinstance of
Dipole The cropped instance.
- selfinstance of
Examples using
crop:
- decimate(decim, offset=0, verbose=None)[source]#
Decimate the time-series data.
- Parameters:
- decim
int Factor by which to subsample the data.
Warning
Low-pass filtering is not performed, this simply selects every Nth sample (where N is the value passed to
decim), i.e., it compresses the signal (see Notes). If the data are not properly filtered, aliasing artifacts may occur.- offset
int Apply an offset to where the decimation starts relative to the sample corresponding to t=0. The offset is in samples at the current sampling rate.
New in version 0.12.
- verbosebool |
str|int|None Control verbosity of the logging output. If
None, use the default verbosity level. See the logging documentation andmne.verbose()for details. Should only be passed as a keyword argument.
- decim
- Returns:
- instMNE-object
The decimated object.
See also
Notes
For historical reasons,
decim/ “decimation” refers to simply subselecting samples from a given signal. This contrasts with the broader signal processing literature, where decimation is defined as (quoting [1], p. 172; which cites [2]):“… a general system for downsampling by a factor of M is the one shown in Figure 4.23. Such a system is called a decimator, and downsampling by lowpass filtering followed by compression [i.e, subselecting samples] has been termed decimation (Crochiere and Rabiner, 1983).”
Hence “decimation” in MNE is what is considered “compression” in the signal processing community.
Decimation can be done multiple times. For example,
inst.decimate(2).decimate(2)will be the same asinst.decimate(4).If
decimis 1, this method does not copy the underlying data.New in version 0.10.0.
References
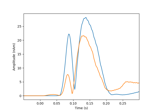
- plot_amplitudes(color='k', show=True)[source]#
Plot the dipole amplitudes as a function of time.
- Parameters:
- Returns:
- fig
matplotlib.figure.Figure The figure object containing the plot.
- fig
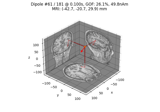
- plot_locations(trans, subject, subjects_dir=None, mode='orthoview', coord_frame='mri', idx='gof', show_all=True, ax=None, block=False, show=True, scale=None, color=None, *, highlight_color='r', fig=None, title=None, head_source='seghead', surf='pial', width=None, verbose=None)[source]#
Plot dipole locations.
If mode is set to ‘arrow’ or ‘sphere’, only the location of the first time point of each dipole is shown else use the show_all parameter.
- Parameters:
- trans
dict|None The mri to head trans. Can be None with mode set to ‘3d’.
- subject
str|None The FreeSurfer subject name (will be used to set the FreeSurfer environment variable
SUBJECT). Can beNonewith mode set to'3d'.- subjects_dirpath-like |
None The path to the directory containing the FreeSurfer subjects reconstructions. If
None, defaults to theSUBJECTS_DIRenvironment variable.- mode
str Can be:
'arrow'or'sphere'Plot in 3D mode using PyVista with the given glyph type.
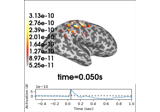
'orthoview'Plot in matplotlib
Axes3Dusing matplotlib with MRI slices shown on the sides of a cube, with the dipole(s) shown as arrows extending outward from a dot (i.e., the arrows pivot on the tail).'outlines'Plot in matplotlib
Axesusing a quiver of arrows for the dipoles in three axes (axial, coronal, and sagittal views), with the arrow pivoting in the middle of the arrow.
Changed in version 1.1: Added support for
'outlines'.- coord_frame
str Coordinate frame to use: ‘head’ or ‘mri’. Can also be ‘mri_rotated’ when mode equals
'outlines'. Defaults to ‘mri’.New in version 0.14.0.
Changed in version 1.1: Added support for
'mri_rotated'.- idx
int| ‘gof’ | ‘amplitude’ Index of the initially plotted dipole. Can also be ‘gof’ to plot the dipole with highest goodness of fit value or ‘amplitude’ to plot the dipole with the highest amplitude. The dipoles can also be browsed through using up/down arrow keys or mouse scroll. Defaults to ‘gof’. Only used if mode equals ‘orthoview’.
New in version 0.14.0.
- show_allbool
Whether to always plot all the dipoles. If
True(default), the active dipole is plotted as a red dot and its location determines the shown MRI slices. The non-active dipoles are plotted as small blue dots. IfFalse, only the active dipole is plotted. Only used ifmode='orthoview'.New in version 0.14.0.
- axinstance of matplotlib
Axes3D|listof matplotlibAxes|None Axes to plot into. If None (default), axes will be created. If mode equals
'orthoview', must be a singleAxes3D. If mode equals'outlines', must be a list of threeAxes.New in version 0.14.0.
- blockbool
Whether to halt program execution until the figure is closed. Defaults to False. Only used if mode equals ‘orthoview’.
New in version 0.14.0.
- showbool
Show figure if True. Defaults to True. Only used if mode equals ‘orthoview’.
- scale
float The scale (size in meters) of the dipoles if
modeis not'orthoview'. The default is 0.03 when mode is'outlines'and 0.005 otherwise.- color
tuple The color of the dipoles. The default (None) will use
'y'if mode is'orthoview'andshow_allis True, else ‘r’. Can also be a list of colors to use when mode is'outlines'.Changed in version 0.19.0: Color is now passed in orthoview mode.
- highlight_colorcolor
The highlight color. Only used in orthoview mode with
show_all=True.New in version 0.19.0.
- figinstance of
Figure3D|None 3D figure in which to plot the alignment. If
None, creates a new 600x600 pixel figure with black background. Only used when mode is'arrow'or'sphere'.New in version 0.19.0.
- title
str|None The title of the figure if
mode='orthoview'(ignored for all other modes). IfNone, dipole number and its properties (amplitude, orientation etc.) will be shown. Defaults toNone.New in version 0.21.0.
- head_source
str|listofstr Head source(s) to use. See the
sourceoption ofmne.get_head_surf()for more information. Only used when mode equals'outlines'.New in version 1.1.
- surf
str|None Brain surface to show outlines for, can be
'white','pial', orNone. Only used when mode is'outlines'.New in version 1.1.
- width
float|None Width of the matplotlib quiver arrow, see
matplotlib.axes.Axes.quiver(). If None (default), when mode is'outlines'0.015 will be used, and when mode is'orthoview'the matplotlib default is used.- verbosebool |
str|int|None Control verbosity of the logging output. If
None, use the default verbosity level. See the logging documentation andmne.verbose()for details. Should only be passed as a keyword argument.
- trans
- Returns:
- figinstance of
Figure3Dormatplotlib.figure.Figure The PyVista figure or matplotlib Figure.
- figinstance of
Notes
New in version 0.9.0.
Examples using
plot_locations: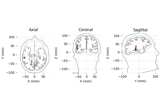
Source localization with equivalent current dipole (ECD) fit
Source localization with equivalent current dipole (ECD) fit
- save(fname, overwrite=False, *, verbose=None)[source]#
Save dipole in a .dip or .bdip file.
- Parameters:
- fname
str The name of the .dip or .bdip file.
- overwritebool
If True (default False), overwrite the destination file if it exists.
New in version 0.20.
- verbosebool |
str|int|None Control verbosity of the logging output. If
None, use the default verbosity level. See the logging documentation andmne.verbose()for details. Should only be passed as a keyword argument.
- fname
Notes
Changed in version 0.20: Support for writing bdip (Xfit binary) files.
- shift_time(tshift, relative=True)[source]#
Shift time scale in epoched or evoked data.
- Parameters:
- tshift
float The (absolute or relative) time shift in seconds. If
relativeis True, positive tshift increases the time value associated with each sample, while negative tshift decreases it.- relativebool
If True, increase or decrease time values by
tshiftseconds. Otherwise, shift the time values such that the time of the first sample equalstshift.
- tshift
- Returns:
- epochsMNE-object
The modified instance.
Notes
This method allows you to shift the time values associated with each data sample by an arbitrary amount. It does not resample the signal or change the data values in any way.
- property times#
Time vector in seconds.
- property tmax#
Last time point.
- property tmin#
First time point.
- to_mni(subject, trans, subjects_dir=None, verbose=None)[source]#
Convert dipole location from head to MNI coordinates.
- Parameters:
- subject
str The FreeSurfer subject name.
- trans
str|dict| instance ofTransform If str, the path to the head<->MRI transform
*-trans.fiffile produced during coregistration. Can also be'fsaverage'to use the built-in fsaverage transformation.- subjects_dirpath-like |
None The path to the directory containing the FreeSurfer subjects reconstructions. If
None, defaults to theSUBJECTS_DIRenvironment variable.- verbosebool |
str|int|None Control verbosity of the logging output. If
None, use the default verbosity level. See the logging documentation andmne.verbose()for details. Should only be passed as a keyword argument.
- subject
- Returns:
- pos_mni
array, shape (n_pos, 3) The MNI coordinates (in mm) of pos.
- pos_mni
Examples using
to_mni:
Source localization with equivalent current dipole (ECD) fit
Source localization with equivalent current dipole (ECD) fit
- to_mri(subject, trans, subjects_dir=None, verbose=None)[source]#
Convert dipole location from head to MRI surface RAS coordinates.
- Parameters:
- subject
str The FreeSurfer subject name.
- trans
str|dict| instance ofTransform If str, the path to the head<->MRI transform
*-trans.fiffile produced during coregistration. Can also be'fsaverage'to use the built-in fsaverage transformation.- subjects_dirpath-like |
None The path to the directory containing the FreeSurfer subjects reconstructions. If
None, defaults to theSUBJECTS_DIRenvironment variable.- verbosebool |
str|int|None Control verbosity of the logging output. If
None, use the default verbosity level. See the logging documentation andmne.verbose()for details. Should only be passed as a keyword argument.
- subject
- Returns:
- pos_mri
array, shape (n_pos, 3) The Freesurfer surface RAS coordinates (in mm) of pos.
- pos_mri
Examples using
to_mri:
Source localization with equivalent current dipole (ECD) fit
Source localization with equivalent current dipole (ECD) fit
- to_volume_labels(trans, subject='fsaverage', aseg='aparc+aseg', subjects_dir=None, verbose=None)[source]#
Find an ROI in atlas for the dipole positions.
- Parameters:
- transpath-like |
dict| instance ofTransform|None If str, the path to the head<->MRI transform
*-trans.fiffile produced during coregistration. Can also be'fsaverage'to use the built-in fsaverage transformation. If trans is None, an identity matrix is assumed.Changed in version 0.19: Support for ‘fsaverage’ argument.
- subject
str The FreeSurfer subject name.
- aseg
str The anatomical segmentation file. Default
aparc+aseg. This may be any anatomical segmentation file in the mri subdirectory of the Freesurfer subject directory.- subjects_dirpath-like |
None The path to the directory containing the FreeSurfer subjects reconstructions. If
None, defaults to theSUBJECTS_DIRenvironment variable.- verbosebool |
str|int|None Control verbosity of the logging output. If
None, use the default verbosity level. See the logging documentation andmne.verbose()for details. Should only be passed as a keyword argument.
- transpath-like |
- Returns:
- labels
list List of anatomical region names from anatomical segmentation atlas.
- labels
Notes
New in version 0.24.
Examples using
to_volume_labels:
Source localization with equivalent current dipole (ECD) fit
Source localization with equivalent current dipole (ECD) fit
Examples using mne.Dipole#
Source localization with equivalent current dipole (ECD) fit
The role of dipole orientations in distributed source localization
Compute sparse inverse solution with mixed norm: MxNE and irMxNE
Computing source timecourses with an XFit-like multi-dipole model