mne.viz.plot_epochs_image#
- mne.viz.plot_epochs_image(epochs, picks=None, sigma=0.0, vmin=None, vmax=None, colorbar=True, order=None, show=True, units=None, scalings=None, cmap=None, fig=None, axes=None, overlay_times=None, combine=None, group_by=None, evoked=True, ts_args=None, title=None, clear=False)[source]#
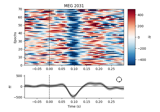
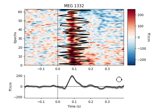
Plot Event Related Potential / Fields image.
- Parameters:
- epochsinstance of
Epochs The epochs.
- picks
str|list|slice|None Channels to include. Slices and lists of integers will be interpreted as channel indices. In lists, channel type strings (e.g.,
['meg',
'eeg']
) will pick channels of those types, channel name strings (e.g.,['MEG0111', 'MEG2623']will pick the given channels. Can also be the string values “all” to pick all channels, or “data” to pick data channels. None (default) will pick good data channels. Note that channels ininfo['bads']will be included if their names or indices are explicitly provided.picksinteracts withgroup_byandcombineto determine the number of figures generated; see Notes.- sigma
float The standard deviation of a Gaussian smoothing window applied along the epochs axis of the image. If 0, no smoothing is applied. Defaults to 0.
- vmin
None|float|callable() The min value in the image (and the ER[P/F]). The unit is µV for EEG channels, fT for magnetometers and fT/cm for gradiometers. If vmin is None and multiple plots are returned, the limit is equalized within channel types. Hint: to specify the lower limit of the data, use
vmin=lambda data: data.min().- vmax
None|float|callable() The max value in the image (and the ER[P/F]). The unit is µV for EEG channels, fT for magnetometers and fT/cm for gradiometers. If vmin is None and multiple plots are returned, the limit is equalized within channel types.
- colorbarbool
Display or not a colorbar.
- order
None|arrayofint|callable() If not
None, order is used to reorder the epochs along the y-axis of the image. If it is an array ofint, its length should match the number of good epochs. If it is a callable it should accept two positional parameters (timesanddata, wheredata.shape == (len(good_epochs), len(times))) and return anarrayof indices that will sortdataalong its first axis.- showbool
Show figure if True.
- units
dict|None The units of the channel types used for axes labels. If None, defaults to
units=dict(eeg='µV', grad='fT/cm', mag='fT').- scalings
dict|None The scalings of the channel types to be applied for plotting. If None, defaults to
scalings=dict(eeg=1e6, grad=1e13, mag=1e15, eog=1e6).- cmap
None| colormap | (colormap, bool) | ‘interactive’ Colormap. If tuple, the first value indicates the colormap to use and the second value is a boolean defining interactivity. In interactive mode the colors are adjustable by clicking and dragging the colorbar with left and right mouse button. Left mouse button moves the scale up and down and right mouse button adjusts the range. Hitting space bar resets the scale. Up and down arrows can be used to change the colormap. If ‘interactive’, translates to (‘RdBu_r’, True). If None, “RdBu_r” is used, unless the data is all positive, in which case “Reds” is used.
- fig
Figure|None Figureinstance to draw the image to. Figure must contain the correct number of axes for drawing the epochs image, the evoked response, and a colorbar (depending on values ofevokedandcolorbar). IfNonea new figure is created. Defaults toNone.- axes
listofAxes|dictoflistofAxes|None List of
Axesobjects in which to draw the image, evoked response, and colorbar (in that order). Length of list must be 1, 2, or 3 (depending on values ofcolorbarandevokedparameters). If adict, each entry must be a list of Axes objects with the same constraints as above. If bothaxesandgroup_byare dicts, their keys must match. Providing non-Nonevalues for bothfigandaxesresults in an error. Defaults toNone.- overlay_timesarray_like, shape (n_epochs,) |
None Times (in seconds) at which to draw a line on the corresponding row of the image (e.g., a reaction time associated with each epoch). Note that
overlay_timesshould be ordered to correspond with theEpochsobject (i.e.,overlay_times[0]corresponds toepochs[0], etc).- combine
None|str|callable() How to combine information across channels. If a
str, must be one of ‘mean’, ‘median’, ‘std’ (standard deviation) or ‘gfp’ (global field power). If callable, the callable must accept one positional input (data of shape(n_epochs, n_channels, n_times)) and return anarrayof shape(n_epochs, n_times). For example:combine = lambda data: np.median(data, axis=1)
If
combineisNone, channels are combined by computing GFP, unlessgroup_byis alsoNoneandpicksis a list of specific channels (not channel types), in which case no combining is performed and each channel gets its own figure. See Notes for further details. Defaults toNone.- group_by
None|dict Specifies which channels are aggregated into a single figure, with aggregation method determined by the
combineparameter. If notNone, oneFigureis made per dict entry; the dict key will be used as the figure title and the dict values must be lists of picks (either channel names or integer indices ofepochs.ch_names). For example:group_by=dict(Left_ROI=[1, 2, 3, 4], Right_ROI=[5, 6, 7, 8])
Note that within a dict entry all channels must have the same type.
group_byinteracts withpicksandcombineto determine the number of figures generated; see Notes. Defaults toNone.- evokedbool
Draw the ER[P/F] below the image or not.
- ts_args
None|dict Arguments passed to a call to
plot_compare_evokedsto style the evoked plot below the image. Defaults to an empty dictionary, meaningplot_compare_evokedswill be called with default parameters.- title
None|str If
str, will be plotted as figure title. Otherwise, the title will indicate channel(s) or channel type being plotted. Defaults toNone.- clearbool
Whether to clear the axes before plotting (if
figoraxesare provided). Defaults toFalse.
- epochsinstance of
- Returns:
Notes
You can control how channels are aggregated into one figure or plotted in separate figures through a combination of the
picks,group_by, andcombineparameters. Ifgroup_byis adict, the result is oneFigureper dictionary key (for any valid values ofpicksandcombine). Ifgroup_byisNone, the number and content of the figures generated depends on the values ofpicksandcombine, as summarized in this table:group_by
picks
combine
result
dict
None, int, list of int, ch_name, list of ch_names, ch_type, list of ch_types
None, string, or callable
1 figure per dict key
None
None, ch_type, list of ch_types
None, string, or callable
1 figure per ch_type
int, ch_name, list of int, list of ch_names
None
1 figure per pick
string or callable
1 figure