mne.viz.plot_brain_colorbar#
- mne.viz.plot_brain_colorbar(ax, clim, colormap='auto', transparent=True, orientation='vertical', label='Activation', bgcolor='0.5')[source]#
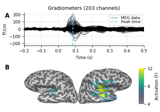
Plot a colorbar that corresponds to a brain activation map.
- Parameters:
- axinstance of
Axes The Axes to plot into.
- clim
str|dict Colorbar properties specification. If ‘auto’, set clim automatically based on data percentiles. If dict, should contain:
kind‘value’ | ‘percent’Flag to specify type of limits.
limslist | np.ndarray | tuple of float, 3 elementsLower, middle, and upper bounds for colormap.
pos_limslist | np.ndarray | tuple of float, 3 elementsLower, middle, and upper bound for colormap. Positive values will be mirrored directly across zero during colormap construction to obtain negative control points.
Note
Only one of
limsorpos_limsshould be provided. Only sequential colormaps should be used withlims, and only divergent colormaps should be used withpos_lims.- colormap
str|np.ndarrayoffloat, shape(n_colors, 3 | 4) Name of colormap to use or a custom look up table. If array, must be (n x 3) or (n x 4) array for with RGB or RGBA values between 0 and 255.
- transparentbool |
None If True: use a linear transparency between fmin and fmid and make values below fmin fully transparent (symmetrically for divergent colormaps). None will choose automatically based on colormap type.
- orientation
str Orientation of the colorbar, can be “vertical” or “horizontal”.
- label
str The colorbar label.
- bgcolorcolor
The color behind the colorbar (for alpha blending).
- axinstance of
- Returns:
- cbarinstance of
ColorbarBase The colorbar.
- cbarinstance of
Notes
New in version 0.19.
