mne.viz.plot_bem#
- mne.viz.plot_bem(subject, subjects_dir=None, orientation='coronal', slices=None, brain_surfaces=None, src=None, show=True, show_indices=True, mri='T1.mgz', show_orientation=True)[source]#
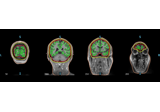
Plot BEM contours on anatomical MRI slices.
- Parameters:
- subject
str The FreeSurfer subject name.
- subjects_dirpath-like |
None The path to the directory containing the FreeSurfer subjects reconstructions. If
None, defaults to theSUBJECTS_DIRenvironment variable.- orientation
str ‘coronal’ or ‘axial’ or ‘sagittal’.
- slices
listofint|None The indices of the MRI slices to plot. If
None, automatically pick 12 equally-spaced slices.- brain_surfaces
None|str|listofstr One or more brain surface to plot (optional). Entries should correspond to files in the subject’s
surfdirectory (e.g."white").- src
None|SourceSpaces|str SourceSpaces instance or path to a source space to plot individual sources as scatter-plot. Sources will be shown on exactly one slice (whichever slice is closest to each source in the given orientation plane). Path can be absolute or relative to the subject’s
bemfolder.Changed in version 0.20: All sources are shown on the nearest slice rather than some being omitted.
- showbool
Show figure if True.
- show_indicesbool
Show slice indices if True.
New in version 0.20.
- mri
str The name of the MRI to use. Can be a standard FreeSurfer MRI such as
'T1.mgz', or a full path to a custom MRI file.New in version 0.21.
- show_orientationbool |
str Show the orientation (L/R, P/A, I/S) of the data slices. True (default) will only show it on the outside most edges of the figure, False will never show labels, and “always” will label each plot.
New in version 0.21.
Changed in version 0.24: Added support for “always”.
- subject
- Returns:
- figinstance of
matplotlib.figure.Figure The figure.
- figinstance of
See also
Notes
Images are plotted in MRI voxel coordinates.
If
srcis not None, for a given slice index, all source points are shown that are halfway between the previous slice and the given slice, and halfway between the given slice and the next slice. For large slice decimations, this can make some source points appear outside the BEM contour, which is shown for the given slice index. For example, in the case where the single midpoint slice is usedslices=[128], all source points will be shown on top of the midpoint MRI slice with the BEM boundary drawn for that slice.