mne.viz.plot_evoked_topo#
- mne.viz.plot_evoked_topo(evoked, layout=None, layout_scale=0.945, color=None, border='none', ylim=None, scalings=None, title=None, proj=False, vline=(0.0,), fig_background=None, merge_grads=False, legend=True, axes=None, background_color='w', noise_cov=None, exclude='bads', select=False, show=True)[source]#
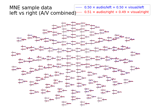
Plot 2D topography of evoked responses.
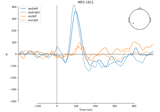
Clicking on the plot of an individual sensor opens a new figure showing the evoked response for the selected sensor.
- Parameters:
- evoked
listofEvoked|Evoked The evoked response to plot.
- layoutinstance of
Layout|None Layout instance specifying sensor positions (does not need to be specified for Neuromag data). If possible, the correct layout is inferred from the data.
- layout_scale
float Scaling factor for adjusting the relative size of the layout on the canvas.
- color
listof color | color |None Everything matplotlib accepts to specify colors. If not list-like, the color specified will be repeated. If None, colors are automatically drawn.
- border
str Matplotlib borders style to be used for each sensor plot.
- ylim
dict|None Y-axis limits for plots (after scaling has been applied).
dictkeys should match channel types; valid keys are for instanceeeg,mag,grad,misc,csd, .. (example:ylim=dict(eeg=[-20, 20])). IfNone, the y-axis limits will be set automatically by matplotlib. Defaults toNone.- scalings
dict|None The scalings of the channel types to be applied for plotting. If None,` defaults to
dict(eeg=1e6, grad=1e13, mag=1e15).- title
str Title of the figure.
- projbool |
'interactive' If true SSP projections are applied before display. If
'interactive', a check box for reversible selection of SSP projection vectors will be shown.- vline
listoffloat|float|None The values at which to show a vertical line.
- fig_background
None|ndarray A background image for the figure. This must work with a call to
plt.imshow. Defaults to None.- merge_gradsbool
Whether to use RMS value of gradiometer pairs. Only works for Neuromag data. Defaults to False.
- legendbool |
int|str|tuple If True, create a legend based on evoked.comment. If False, disable the legend. Otherwise, the legend is created and the parameter value is passed as the location parameter to the matplotlib legend call. It can be an integer (e.g. 0 corresponds to upper right corner of the plot), a string (e.g.
'upper right'), or a tuple (x, y coordinates of the lower left corner of the legend in the axes coordinate system). See matplotlib documentation for more details.- axesinstance of matplotlib
Axes|None Axes to plot into. If None, axes will be created.
- background_colorcolor
Background color. Typically
'k'(black) or'w'(white; default).New in v0.15.0.
- noise_covinstance of
Covariance|str|None Noise covariance used to whiten the data while plotting. Whitened data channel names are shown in italic. Can be a string to load a covariance from disk.
New in v0.16.0.
- exclude
listofstr|'bads' Channels names to exclude from the plot. If
'bads', the bad channels are excluded. By default, exclude is set to'bads'.- selectbool
Whether to enable the lasso-selection tool to enable the user to select channels. The selected channels will be available in
fig.lasso.selection.New in v1.10.0.
- exclude
listofstr|'bads' Channels names to exclude from the plot. If
'bads', the bad channels are excluded. By default, exclude is set to'bads'.- showbool
Show figure if True.
- evoked
- Returns:
- figinstance of
matplotlib.figure.Figure Images of evoked responses at sensor locations.
- figinstance of
Examples using mne.viz.plot_evoked_topo#
Preprocessing functional near-infrared spectroscopy (fNIRS) data