mne.viz.plot_compare_evokeds#
- mne.viz.plot_compare_evokeds(evokeds, picks=None, colors=None, linestyles=None, styles=None, cmap=None, vlines='auto', ci=True, truncate_yaxis='auto', truncate_xaxis=True, ylim=None, invert_y=False, show_sensors=None, legend=True, split_legend=None, axes=None, title=None, show=True, combine=None, sphere=None, time_unit='s')[source]#
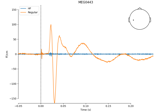
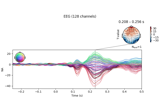
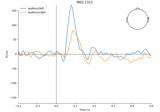
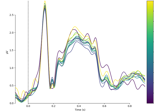
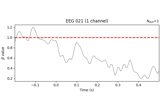
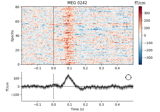
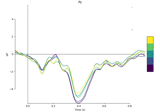
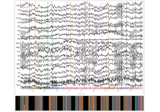
Plot evoked time courses for one or more conditions and/or channels.
- Parameters:
- evokedsinstance of
mne.Evoked|list|dict If a single Evoked instance, it is plotted as a time series. If a list of Evokeds, the contents are plotted with their
.commentattributes used as condition labels. If no comment is set, the index of the respective Evoked the list will be used instead, starting with1for the first Evoked. If a dict whose values are Evoked objects, the contents are plotted as single time series each and the keys are used as labels. If a [dict/list] of lists, the unweighted mean is plotted as a time series and the parametric confidence interval is plotted as a shaded area. All instances must have the same shape - channel numbers, time points etc. If dict, keys must be of typestr.- picks
str| array_like |slice|None Channels to include. Slices and lists of integers will be interpreted as channel indices. In lists, channel type strings (e.g.,
['meg',
'eeg']
) will pick channels of those types, channel name strings (e.g.,['MEG0111', 'MEG2623']will pick the given channels. Can also be the string values'all'to pick all channels, or'data'to pick data channels. None (default) will pick all data channels. Note that channels ininfo['bads']will be included if their names or indices are explicitly provided.If picks is None or a (collection of) data channel types, the global field power will be plotted for all data channels. Otherwise, picks will be averaged.
If multiple channel types are selected, one figure will be returned for each channel type.
If the selected channels are gradiometers, the signal from corresponding (gradiometer) pairs will be combined.
- colors
list|dict|None Colors to use when plotting the ERP/F lines and confidence bands. If
cmapis notNone,colorsmust be alistordictofintsorfloatsindicating steps or percentiles (respectively) along the colormap. IfcmapisNone, list elements or dict values ofcolorsmust beintsor valid matplotlib colors; lists are cycled through sequentially, while dicts must have keys matching the keys or conditions of anevokedsdict (see Notes for details). IfNone, the current matplotlib color cycle is used. Defaults toNone.- linestyles
list|dict|None Styles to use when plotting the ERP/F lines. If a
listordict, elements must be valid matplotlib linestyles. Lists are cycled through sequentially; dictionaries must have keys matching the keys or conditions of anevokedsdict (see Notes for details). IfNone, all lines will be solid. Defaults toNone.- styles
dict|None Dictionary of styles to use when plotting ERP/F lines. Keys must match keys or conditions of
evokeds, and values must be adictof legal inputs tomatplotlib.pyplot.plot(). Those values will be passed as parameters to the line plot call of the corresponding condition, overriding defaults (e.g.,styles={"Aud/L": {"linewidth": 3}}will set the linewidth for “Aud/L” to 3). As withcolorsandlinestyles, keys matching conditions in/-separatedevokedskeys are supported (see Notes for details).- cmap
None|str|tuple| instance ofmatplotlib.colors.Colormap Colormap from which to draw color values when plotting the ERP/F lines and confidence bands. If not
None, ints or floats in thecolorsparameter are mapped to steps or percentiles (respectively) along the colormap. Ifcmapis astr, it will be passed tomatplotlib.colormaps; ifcmapis a tuple, its first element will be used as a string to label the colorbar, and its second element will be passed tomatplotlib.colormaps(unless it is already an instance ofColormap).Changed in version 0.19: Support for passing
Colormapinstances.- vlines
"auto"|listoffloat A list in seconds at which to plot dashed vertical lines. If
"auto"and the supplied data includes 0, it is set to[0.]and a vertical bar is plotted at time 0. If an empty list is passed, no vertical lines are plotted.- ci
float| bool |callable()|None Confidence band around each ERP/F time series. If
FalseorNoneno confidence band is drawn. Iffloat,cimust be between 0 and 1, and will set the threshold for a bootstrap (single plot)/parametric (whenaxes=='topo') estimation of the confidence band;Trueis equivalent to setting a threshold of 0.95 (i.e., the 95% confidence band is drawn). If a callable, it must take a single array (n_observations × n_times) as input and return upper and lower confidence margins (2 × n_times). Defaults toTrue.- truncate_yaxisbool |
'auto' Whether to shorten the y-axis spine. If
'auto', the spine is truncated at the minimum and maximum ticks. IfTrue, it is truncated at the multiple of 0.25 nearest to half the maximum absolute value of the data. Iftruncate_xaxis=False, only the far bound of the y-axis will be truncated. Defaults to'auto'.- truncate_xaxisbool
Whether to shorten the x-axis spine. If
True, the spine is truncated at the minimum and maximum ticks. Iftruncate_yaxis=False, only the far bound of the x-axis will be truncated. Defaults toTrue.- ylim
dict|None Y-axis limits for plots (after scaling has been applied).
dictkeys should match channel types; valid keys are for instanceeeg,mag,grad,misc,csd, .. (example:ylim=dict(eeg=[-20, 20])). IfNone, the y-axis limits will be set automatically by matplotlib. Defaults toNone.- invert_ybool
Whether to plot negative values upward (as is sometimes done for ERPs out of tradition). Defaults to
False.- show_sensorsbool |
int|str|None Whether to display an inset showing sensor locations on a head outline. If
intorstr, indicates position of the inset (seempl_toolkits.axes_grid1.inset_locator.inset_axes()). IfNone, treated asTrueif there is only one channel inpicks. IfTrue, location is upper or lower right corner, depending on data values. Defaults toNone.- legendbool |
int|str Whether to show a legend for the colors/linestyles of the conditions plotted. If
intorstr, indicates position of the legend (seempl_toolkits.axes_grid1.inset_locator.inset_axes()). IfTrue, equivalent to'upper left'. Defaults toTrue.- split_legendbool |
None Whether to separate color and linestyle in the legend. If
None, a separate linestyle legend will still be shown ifcmapis specified. Defaults toNone.- axes
None|Axesinstance |listofAxes|'topo' Axesobject to plot into. If plotting multiple channel types (or multiple channels whencombine=None),axesshould be a list of appropriate length containingAxesobjects. If'topo', a newFigureis created with one axis for each channel, in a topographical layout. IfNone, a newFigureis created for each channel type. Defaults toNone.- title
str|None Title printed above the plot. If
None, a title will be automatically generated based on channel name(s) or type(s) and the value of thecombineparameter. Defaults toNone.- showbool
Whether to show the figure. Defaults to
True.- combine‘mean’ | ‘median’ | ‘std’ | ‘gfp’ |
callable()|None How to aggregate across channels. If
None, channels are combined by computing GFP/RMS, unlesspicksis a single channel (not channel type) oraxes="topo", in which cases no combining is performed. If a string,"mean"usesnumpy.mean(),"median"computes the marginal median,"std"usesnumpy.std(), and"gfp"computes global field power for EEG channels and RMS amplitude for MEG channels. Ifcallable(), it must operate on anarrayof shape(n_evokeds, n_channels, n_times)and return an array of shape(n_evokeds, n_times). For example:combine = lambda data: np.median(data, axis=1)
Defaults to
None.- sphere
float| array_like offloat| instance ofConductorModel|str|listofstr|None The sphere parameters to use for the head outline. Can be array-like of shape (4,) to give the X/Y/Z origin and radius in meters, or a single float to give just the radius (origin assumed 0, 0, 0). Can also be an instance of a spherical
ConductorModelto use the origin and radius from that object. Can also be astr, in which case:'auto': the sphere is fit to external digitization points first, and to external + EEG digitization points if the former fails.'eeglab': the head circle is defined by EEG electrodes'Fpz','Oz','T7', and'T8'(if'Fpz'is not present, it will be approximated from the coordinates of'Oz').'extra': the sphere is fit to external digitization points.'eeg': the sphere is fit to EEG digitization points.'cardinal': the sphere is fit to cardinal digitization points.'hpi': the sphere is fit to HPI coil digitization points.
Can also be a list of
str, in which case the sphere is fit to the specified digitization points, which can be any combination of'extra','eeg','cardinal', and'hpi', as specified above.None(the default) is equivalent to'auto'when enough extra digitization points are available, and (0, 0, 0, 0.095) otherwise.New in v0.20.
Changed in version 1.1: Added
'eeglab'option.Changed in version 1.11: Added
'extra','eeg','cardinal','hpi'and list ofstroptions.- time_unit
str The units for the time axis, can be “s” (default) or “ms”.
New in v1.1.
- evokedsinstance of
- Returns:
Notes
If the parameters
styles,colors, orlinestylesare passed asdicts, thenevokedsmust also be adict, and the keys of the plot-style parameters must either match the keys ofevokeds, or match a/-separated partial key (“condition”) ofevokeds. For example, if evokeds has keys “Aud/L”, “Aud/R”, “Vis/L”, and “Vis/R”, thenlinestyles=dict(L='--', R='-')will plot both Aud/L and Vis/L conditions with dashed lines and both Aud/R and Vis/R conditions with solid lines. Similarly,colors=dict(Aud='r', Vis='b')will plot Aud/L and Aud/R conditions red and Vis/L and Vis/R conditions blue.Color specification depends on whether a colormap has been provided in the
cmapparameter. The following table summarizes how thecolorsparameter is interpreted:cmapcolorsresult
None
None
matplotlib default color cycle; unique color for each condition
list or dict of integers
matplotlib default color cycle; lowest integer mapped to first cycle color; conditions with same integer get same color; unspecified conditions are “gray”
list or dict of floats
ValueErrorlist or dict of hexadecimal color strings
the specified hex colors; unspecified conditions are “gray”
string or instance of matplotlib Colormap
None
equally spaced colors on the colormap; unique color for each condition
list or dict of integers
equally spaced colors on the colormap; lowest integer mapped to first cycle color; conditions with same integer get same color
list or dict of floats
floats mapped to corresponding colormap values
list or dict of hexadecimal color strings
TypeError
Examples using mne.viz.plot_compare_evokeds#
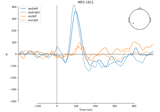
Single trial linear regression analysis with the LIMO dataset
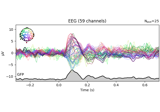
Analysing continuous features with binning and regression in sensor space
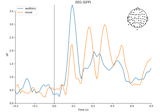
Preprocessing functional near-infrared spectroscopy (fNIRS) data
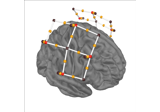
Spatiotemporal permutation F-test on full sensor data