mne.viz.plot_dipole_amplitudes#
- mne.viz.plot_dipole_amplitudes(dipoles, colors=None, show=True)[source]#
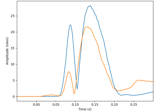
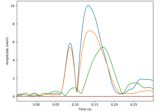
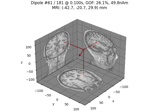
Plot the amplitude traces of a set of dipoles.
- Parameters:
- Returns:
- fig
matplotlib.figure.Figure The figure object containing the plot.
- fig
Notes
New in v0.9.0.
Examples using mne.viz.plot_dipole_amplitudes#
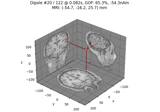
Compute a sparse inverse solution using the Gamma-MAP empirical Bayesian method
Compute a sparse inverse solution using the Gamma-MAP empirical Bayesian method
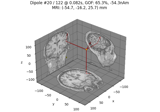
Compute sparse inverse solution with mixed norm: MxNE and irMxNE
Compute sparse inverse solution with mixed norm: MxNE and irMxNE