mne.viz.plot_projs_joint#
- mne.viz.plot_projs_joint(projs, evoked, picks_trace=None, *, topomap_kwargs=None, show=True, verbose=None)[source]#
Plot projectors and evoked jointly.
- Parameters:
- projs
listofProjection The projectors to plot.
- evokedinstance of
Evoked The data to plot. Typically this is the evoked instance created from averaging the epochs used to create the projection.
- picks_trace
str| array_like |slice|None Channels to show alongside the projected time courses. Typically these are the ground-truth channels for an artifact (e.g.,
'eog'or'ecg'). Slices and lists of integers will be interpreted as channel indices. In lists, channel type strings (e.g.,['meg', 'eeg']) will pick channels of those types, channel name strings (e.g.,['MEG0111', 'MEG2623']will pick the given channels. Can also be the string values'all'to pick all channels, or'data'to pick data channels. None (default) will pick no channels.- topomap_kwargs
dict|None Keyword arguments to pass to
mne.viz.plot_projs_topomap().- showbool
Show the figure if
True.- verbosebool |
str|int|None Control verbosity of the logging output. If
None, use the default verbosity level. See the logging documentation andmne.verbose()for details. Should only be passed as a keyword argument.
- projs
- Returns:
- figinstance of matplotlib
Figure The figure.
- figinstance of matplotlib
Notes
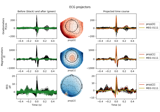
This function creates a figure with three columns:
The left shows the evoked data traces before (black) and after (green) projection.
The center shows the topomaps associated with each of the projectors.
The right again shows the data traces (black), but this time with:
The data projected onto each projector with a single normalization factor (solid lines). This is useful for seeing the relative power in each projection vector.
The data projected onto each projector with individual normalization factors (dashed lines). This is useful for visualizing each time course regardless of its power.
Additional data traces from
picks_trace(solid yellow lines). This is useful for visualizing the “ground truth” of the time course, e.g. the measured EOG or ECG channel time courses.
New in v1.1.