mne.viz.plot_head_positions#
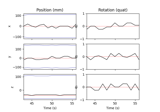
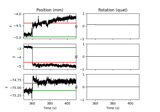
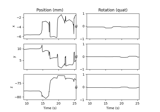
- mne.viz.plot_head_positions(pos, mode='traces', cmap='viridis', direction='z', *, show=True, destination=None, info=None, color='k', axes=None, totals=False)[source]#
Plot head positions.
- Parameters:
- pos
ndarray, shape (n_pos, 10) |listofndarray The head position data. Can also be a list to treat as a concatenation of runs.
- mode
str Can be ‘traces’ (default) to show position and quaternion traces, or ‘field’ to show the position as a vector field over time.
- cmapcolormap
Colormap to use for the trace plot, default is “viridis”.
- direction
str Can be any combination of “x”, “y”, or “z” (default: “z”) to show directional axes in “field” mode.
- showbool
Show figure if True. Defaults to True.
- destinationpath-like | array_like, shape (3,) | instance of
Transform|None The destination location for the head. See
mne.preprocessing.maxwell_filter()for details.New in v0.16.
- info
mne.Info|None The
mne.Infoobject with information about the sensors and methods of measurement. If provided, will be used to show the destination position whendestination is None, and for showing the MEG sensors.New in v0.16.
- colorcolor object
The color to use for lines in
mode == 'traces'and quiver arrows inmode == 'field'.New in v0.16.
- axesarray_like, shape (3, 2) or (4, 2)
The matplotlib axes to use.
New in v0.16.
Changed in version 1.8: Added support for making use of this argument when
mode="field".- totalsbool
If True and in traces mode, show the total distance and angle in a fourth row.
New in v1.9.
- pos
- Returns:
- figinstance of
matplotlib.figure.Figure The figure.
- figinstance of
Examples using mne.viz.plot_head_positions#
Annotate movement artifacts and reestimate dev_head_t
Signal-space separation (SSS) and Maxwell filtering