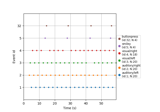
mne.viz.plot_events#
- mne.viz.plot_events(events, sfreq=None, first_samp=0, color=None, event_id=None, axes=None, equal_spacing=True, show=True, on_missing='raise', verbose=None)[source]#
Plot events to get a visual display of the paradigm.
- Parameters:
- events
ndarrayofint, shape (n_events, 3) The identity and timing of experimental events, around which the epochs were created. See events for more information.
- sfreq
float|None The sample frequency. If None, data will be displayed in samples (not seconds).
- first_samp
int The index of the first sample. Recordings made on Neuromag systems number samples relative to the system start (not relative to the beginning of the recording). In such cases the
raw.first_sampattribute can be passed here. Default is 0.- color
dict|None Dictionary of event_id integers as keys and colors as values. If None, colors are automatically drawn from a default list (cycled through if number of events longer than list of default colors). Color can be any valid matplotlib color.
- event_id
dict|None Dictionary of event labels (e.g. ‘aud_l’) as keys and their associated event_id values. Labels are used to plot a legend. If None, no legend is drawn.
- axesinstance of
Axes The subplot handle.
- equal_spacingbool
Use equal spacing between events in y-axis.
- showbool
Show figure if True.
- on_missing‘raise’ | ‘warn’ | ‘ignore’
Can be
'raise'(default) to raise an error,'warn'to emit a warning, or'ignore'to ignore when event numbers fromevent_idare missing from events. When numbers from events are missing fromevent_idthey will be ignored and a warning emitted; consider usingverbose='error'in this case.New in v0.21.
- verbosebool |
str|int|None Control verbosity of the logging output. If
None, use the default verbosity level. See the logging documentation andmne.verbose()for details. Should only be passed as a keyword argument.
- events
- Returns:
- fig
matplotlib.figure.Figure The figure object containing the plot.
- fig
Notes
New in v0.9.0.
Examples using mne.viz.plot_events#
Single trial linear regression analysis with the LIMO dataset
Automated epochs metadata generation with variable time windows
Sleep stage classification from polysomnography (PSG) data
Preprocessing functional near-infrared spectroscopy (fNIRS) data