mne.viz.plot_dipole_locations#
- mne.viz.plot_dipole_locations(dipoles, trans=None, subject=None, subjects_dir=None, mode='orthoview', coord_frame='mri', idx='gof', show_all=True, ax=None, block=False, show=True, scale=None, color=None, *, highlight_color='r', fig=None, title=None, head_source='seghead', surf='pial', width=None, verbose=None)[source]#
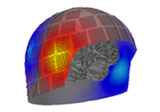
Plot dipole locations.
If mode is set to ‘arrow’ or ‘sphere’, only the location of the first time point of each dipole is shown else use the show_all parameter.
- Parameters:
- dipoles
listof instances ofDipole|Dipole The dipoles to plot.
- trans
dict|None The mri to head trans. Can be None with mode set to ‘3d’.
- subject
str|None The FreeSurfer subject name (will be used to set the FreeSurfer environment variable
SUBJECT). Can beNonewith mode set to'3d'.- subjects_dirpath-like |
None The path to the directory containing the FreeSurfer subjects reconstructions. If
None, defaults to theSUBJECTS_DIRenvironment variable.- mode
str Can be:
'arrow'or'sphere'Plot in 3D mode using PyVista with the given glyph type.
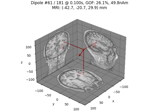
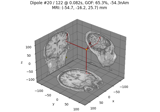
'orthoview'Plot in matplotlib
Axes3Dusing matplotlib with MRI slices shown on the sides of a cube, with the dipole(s) shown as arrows extending outward from a dot (i.e., the arrows pivot on the tail).'outlines'Plot in matplotlib
Axesusing a quiver of arrows for the dipoles in three axes (axial, coronal, and sagittal views), with the arrow pivoting in the middle of the arrow.
Changed in version 1.1: Added support for
'outlines'.- coord_frame
str Coordinate frame to use: ‘head’ or ‘mri’. Can also be ‘mri_rotated’ when mode equals
'outlines'. Defaults to ‘mri’.New in v0.14.0.
Changed in version 1.1: Added support for
'mri_rotated'.- idx
int| ‘gof’ | ‘amplitude’ Index of the initially plotted dipole. Can also be ‘gof’ to plot the dipole with highest goodness of fit value or ‘amplitude’ to plot the dipole with the highest amplitude. The dipoles can also be browsed through using up/down arrow keys or mouse scroll. Defaults to ‘gof’. Only used if mode equals ‘orthoview’.
New in v0.14.0.
- show_allbool
Whether to always plot all the dipoles. If
True(default), the active dipole is plotted as a red dot and its location determines the shown MRI slices. The non-active dipoles are plotted as small blue dots. IfFalse, only the active dipole is plotted. Only used ifmode='orthoview'.New in v0.14.0.
- axinstance of matplotlib
Axes3D|listof matplotlibAxes|None Axes to plot into. If None (default), axes will be created. If mode equals
'orthoview', must be a singleAxes3D. If mode equals'outlines', must be a list of threeAxes.New in v0.14.0.
- blockbool
Whether to halt program execution until the figure is closed. Defaults to False. Only used if mode equals ‘orthoview’.
New in v0.14.0.
- showbool
Show figure if True. Defaults to True. Only used if mode equals ‘orthoview’.
- scale
float The scale (size in meters) of the dipoles if
modeis not'orthoview'. The default is 0.03 when mode is'outlines'and 0.005 otherwise.- color
tuple The color of the dipoles. The default (None) will use
'y'if mode is'orthoview'andshow_allis True, else ‘r’. Can also be a list of colors to use when mode is'outlines'.Changed in version 0.19.0: Color is now passed in orthoview mode.
- highlight_colorcolor
The highlight color. Only used in orthoview mode with
show_all=True.New in v0.19.0.
- figinstance of
Figure3D|None 3D figure in which to plot the alignment. If
None, creates a new 600x600 pixel figure with black background. Only used when mode is'arrow'or'sphere'.New in v0.19.0.
- title
str|None The title of the figure if
mode='orthoview'(ignored for all other modes). IfNone, dipole number and its properties (amplitude, orientation etc.) will be shown. Defaults toNone.New in v0.21.0.
- head_source
str|listofstr Head source(s) to use. See the
sourceoption ofmne.get_head_surf()for more information. Only used when mode equals'outlines'.New in v1.1.
- surf
str|None Brain surface to show outlines for, can be
'white','pial', orNone. Only used when mode is'outlines'.New in v1.1.
- width
float|None Width of the matplotlib quiver arrow, see
matplotlib.axes.Axes.quiver(). If None (default), when mode is'outlines'0.015 will be used, and when mode is'orthoview'the matplotlib default is used.- verbosebool |
str|int|None Control verbosity of the logging output. If
None, use the default verbosity level. See the logging documentation andmne.verbose()for details. Should only be passed as a keyword argument.
- dipoles
- Returns:
- figinstance of
Figure3Dormatplotlib.figure.Figure The PyVista figure or matplotlib Figure.
- figinstance of
Notes
New in v0.9.0.
Examples using mne.viz.plot_dipole_locations#
Compute a sparse inverse solution using the Gamma-MAP empirical Bayesian method
Compute sparse inverse solution with mixed norm: MxNE and irMxNE

The role of dipole orientations in distributed source localization