mne.stats.permutation_cluster_test#
- mne.stats.permutation_cluster_test(X, threshold=None, n_permutations=1024, tail=0, stat_fun=None, adjacency=None, n_jobs=None, seed=None, max_step=1, exclude=None, step_down_p=0, t_power=1, out_type='indices', check_disjoint=False, buffer_size=1000, verbose=None)[source]#
Cluster-level statistical permutation test.
For a list of
NumPy arraysof data, calculate some statistics corrected for multiple comparisons using permutations and cluster-level correction. Each element of the listXshould contain the data for one group of observations (e.g., 2D arrays for time series, 3D arrays for time-frequency power values). Permutations are generated with random partitions of the data. For details, see [1][2].- Parameters:
- X
listofarray, shape (n_observations, p[, q][, r]) The data to be clustered. Each array in
Xshould contain the observations for one group. The first dimension of each array is the number of observations from that group; remaining dimensions comprise the size of a single observation. For example ifX = [X1, X2]withX1.shape = (20, 50, 4)andX2.shape = (17, 50, 4), thenXhas 2 groups with respectively 20 and 17 observations in each, and each data point is of shape(50, 4). Note: that the last dimension of each element ofXshould correspond to the dimension represented in theadjacencyparameter (e.g., spectral data should be provided as(observations, frequencies, channels/vertices)).- threshold
float|dict|None The so-called “cluster forming threshold” in the form of a test statistic (note: this is not an alpha level / “p-value”). If numeric, vertices with data values more extreme than
thresholdwill be used to form clusters. IfNone, an F-threshold will be chosen automatically that corresponds to a p-value of 0.05 for the given number of observations (only valid when using an F-statistic). Ifthresholdis adict(with keys'start'and'step') then threshold-free cluster enhancement (TFCE) will be used (see the TFCE example and [3]). See Notes for an example on how to compute a threshold based on a particular p-value for one-tailed or two-tailed tests.- n_permutations
int The number of permutations to compute.
- tail
int If tail is 1, the statistic is thresholded above threshold. If tail is -1, the statistic is thresholded below threshold. If tail is 0, the statistic is thresholded on both sides of the distribution.
- stat_fun
callable()|None Function called to calculate the test statistic. Must accept 1D-array as input and return a 1D array. If
None(the default), usesmne.stats.f_oneway.- adjacency
scipy.sparse.spmatrix|None|False Defines adjacency between locations in the data, where “locations” can be spatial vertices, frequency bins, time points, etc. For spatial vertices (i.e. sensor space data), see
mne.channels.find_ch_adjacency()ormne.spatial_inter_hemi_adjacency(). For source space data, seemne.spatial_src_adjacency()ormne.spatio_temporal_src_adjacency(). IfFalse, assumes no adjacency (each location is treated as independent and unconnected). IfNone, a regular lattice adjacency is assumed, connecting each location to its neighbor(s) along the last dimension of each groupX[k](or the last two dimensions ifX[k]is 2D). Ifadjacencyis a matrix, it is assumed to be symmetric (only the upper triangular half is used) and must be square with dimension equal toX[k].shape[-1](for 2D data) orX[k].shape[-1] * X[k].shape[-2](for 3D data) or (optionally)X[k].shape[-1] * X[k].shape[-2] * X[k].shape[-3](for 4D data). The functionmne.stats.combine_adjacencymay be useful for 4D data.- n_jobs
int|None The number of jobs to run in parallel. If
-1, it is set to the number of CPU cores. Requires thejoblibpackage.None(default) is a marker for ‘unset’ that will be interpreted asn_jobs=1(sequential execution) unless the call is performed under ajoblib.parallel_configcontext manager that sets another value forn_jobs.- seed
None|int| instance ofRandomState A seed for the NumPy random number generator (RNG). If
None(default), the seed will be obtained from the operating system (seeRandomStatefor details), meaning it will most likely produce different output every time this function or method is run. To achieve reproducible results, pass a value here to explicitly initialize the RNG with a defined state.- max_step
int Maximum distance between samples along the second axis of
Xto be considered adjacent (typically the second axis is the “time” dimension). Only used whenadjacencyhas shape (n_vertices, n_vertices), that is, when adjacency is only specified for sensors (e.g., viamne.channels.find_ch_adjacency()), and not via sensors and further dimensions such as time points (e.g., via an additional call ofmne.stats.combine_adjacency()).- excludebool
arrayorNone Mask to apply to the data to exclude certain points from clustering (e.g., medial wall vertices). Should be the same shape as
X. IfNone, no points are excluded.- step_down_p
float To perform a step-down-in-jumps test, pass a p-value for clusters to exclude from each successive iteration. Default is zero, perform no step-down test (since no clusters will be smaller than this value). Setting this to a reasonable value, e.g. 0.05, can increase sensitivity but costs computation time.
- t_power
float Power to raise the statistical values (usually F-values) by before summing (sign will be retained). Note that
t_power=0will give a count of locations in each cluster,t_power=1will weight each location by its statistical score.- out_type‘mask’ | ‘indices’
Output format of clusters within a list. If
'mask', returns a list of boolean arrays, each with the same shape as the input data (or slices if the shape is 1D and adjacency is None), withTruevalues indicating locations that are part of a cluster. If'indices', returns a list of tuple of ndarray, where each ndarray contains the indices of locations that together form the given cluster along the given dimension. Note that for large datasets,'indices'may use far less memory than'mask'. Default is'indices'.- check_disjointbool
Whether to check if the connectivity matrix can be separated into disjoint sets before clustering. This may lead to faster clustering, especially if the second dimension of
X(usually the “time” dimension) is large.- buffer_size
int|None Block size to use when computing test statistics. This can significantly reduce memory usage when
n_jobs > 1and memory sharing between processes is enabled (seemne.set_cache_dir()), becauseXwill be shared between processes and each process only needs to allocate space for a small block of locations at a time.- verbosebool |
str|int|None Control verbosity of the logging output. If
None, use the default verbosity level. See the logging documentation andmne.verbose()for details. Should only be passed as a keyword argument.
- X
- Returns:
Notes
For computing a
thresholdbased on a p-value, use the conversion fromscipy.stats.rv_continuous.ppf():pval = 0.001 # arbitrary dfn = n_conditions - 1 # degrees of freedom numerator dfd = n_observations - n_conditions # degrees of freedom denominator thresh = scipy.stats.f.ppf(1 - pval, dfn=dfn, dfd=dfd) # F distribution
References
Examples using mne.stats.permutation_cluster_test#
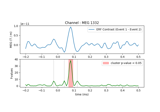
Permutation F-test on sensor data with 1D cluster level
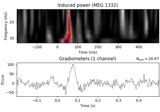
Non-parametric between conditions cluster statistic on single trial power
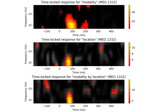
Mass-univariate twoway repeated measures ANOVA on single trial power