mne.channels.Layout#
- class mne.channels.Layout(box, pos, names, ids, kind)[source]#
Sensor layouts.
Layouts are typically loaded from a file using
read_layout(). Only use this class directly if you’re constructing a new layout.- Parameters:
Methods
copy()Return a copy of the layout.
pick([picks, exclude, verbose])Pick a subset of channels.
plot([picks, show_axes, show])Plot the sensor positions.
save(fname[, overwrite])Save Layout to disk.
- copy()[source]#
Return a copy of the layout.
- Returns:
- layoutinstance of
Layout A deepcopy of the layout.
- layoutinstance of
Notes
New in v1.7.
- pick(picks=None, exclude=(), *, verbose=None)[source]#
Pick a subset of channels.
- Parameters:
- picksarray_like of
strorint|slice|'all'|None Channels to include in the layout. Slices and lists of integers will be interpreted as channel indices. Can also be the string value
'all'to pick all channels. None (default) will pick all channels.- exclude
str|int| array_like ofstrorint Set of channels to exclude, only used when
picksis set to'all'orNone. Exclude will not drop channels explicitly provided inpicks.- verbosebool |
str|int|None Control verbosity of the logging output. If
None, use the default verbosity level. See the logging documentation andmne.verbose()for details. Should only be passed as a keyword argument.
- picksarray_like of
- Returns:
- layoutinstance of
Layout The modified layout.
- layoutinstance of
Notes
New in v1.7.
- plot(picks=None, show_axes=False, show=True)[source]#
Plot the sensor positions.
- Parameters:
- picks
list|slice|None Channels to include. Slices and lists of integers will be interpreted as channel indices. None (default) will pick all channels. Note that channels in
info['bads']will be included if their indices are explicitly provided.- show_axesbool
Show layout axes if True. Defaults to False.
- showbool
Show figure if True. Defaults to True.
- picks
- Returns:
- figinstance of
matplotlib.figure.Figure Figure containing the sensor topography.
- figinstance of
Notes
New in v0.12.0.
Examples using
plot:
Examples using mne.channels.Layout#
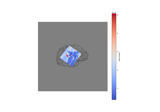
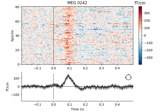
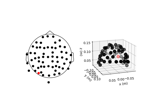
How to convert 3D electrode positions to a 2D image