mne.time_frequency.Spectrum#
- class mne.time_frequency.Spectrum(inst, method, fmin, fmax, tmin, tmax, picks, exclude, proj, remove_dc, reject_by_annotation, *, n_jobs, verbose=None, **method_kw)[source]#
Data object for spectral representations of continuous data.
Warning
The preferred means of creating Spectrum objects from continuous or averaged data is via the instance methods
mne.io.Raw.compute_psd()ormne.Evoked.compute_psd(). Direct class instantiation is not supported.- Parameters:
- instinstance of
RaworEvoked The data from which to compute the frequency spectrum.
- method
'welch'|'multitaper'|'auto' Spectral estimation method.
'welch'uses Welch’s method [1],'multitaper'uses DPSS tapers [2].'auto'(default) uses Welch’s method for continuous data and multitaper forEvokeddata.- fmin, fmax
float The lower- and upper-bound on frequencies of interest. Default is
fmin=0, fmax=np.inf(spans all frequencies present in the data).- tmin, tmax
float|None First and last times to include, in seconds.
Noneuses the first or last time present in the data. Default istmin=None, tmax=None(all times).- picks
str| array_like |slice|None Channels to include. Slices and lists of integers will be interpreted as channel indices. In lists, channel type strings (e.g.,
['meg',
'eeg']
) will pick channels of those types, channel name strings (e.g.,['MEG0111', 'MEG2623']will pick the given channels. Can also be the string values'all'to pick all channels, or'data'to pick data channels. None (default) will pick good data channels (excluding reference MEG channels). Note that channels ininfo['bads']will be included if their names or indices are explicitly provided.- exclude
listofstr| ‘bads’ Channel names to exclude. If
'bads', channels ininfo['bads']are excluded; pass an empty list to include all channels (including “bad” channels, if any).- projbool
Whether to apply SSP projection vectors before spectral estimation. Default is
False.- remove_dcbool
If
True, the mean is subtracted from each segment before computing its spectrum.- reject_by_annotationbool
Whether to omit bad spans of data before spectral estimation. If
True, spans with annotations whose description begins withbadwill be omitted.- n_jobs
int|None The number of jobs to run in parallel. If
-1, it is set to the number of CPU cores. Requires thejoblibpackage.None(default) is a marker for ‘unset’ that will be interpreted asn_jobs=1(sequential execution) unless the call is performed under ajoblib.parallel_configcontext manager that sets another value forn_jobs.- verbosebool |
str|int|None Control verbosity of the logging output. If
None, use the default verbosity level. See the logging documentation andmne.verbose()for details. Should only be passed as a keyword argument.- **method_kw
Additional keyword arguments passed to the spectral estimation function (e.g.,
n_fft, n_overlap, n_per_seg, average, windowfor Welch method, orbandwidth, adaptive, low_bias, normalizationfor multitaper method). Seepsd_array_welch()andpsd_array_multitaper()for details. Note that for Welch method ifn_fftis unspecified its default will be the smaller of2048or the number of available time samples (taking into accounttminandtmax), not256as inpsd_array_welch().
- instinstance of
- Attributes:
- ch_names
list The channel names.
- freqs
array Frequencies at which the amplitude, power, or fourier coefficients have been computed.
- info
mne.Info The
mne.Infoobject with information about the sensors and methods of measurement.- method
'welch'|'multitaper' The method used to compute the spectrum.
- nave
int|None The number of trials averaged together when generating the spectrum.
Noneindicates no averaging is known to have occurred.- weights
array|None The weights for each taper. Only present if spectra computed with
method='multitaper'andoutput='complex'.New in v1.8.
- ch_names
Methods
__contains__(ch_type)Check channel type membership.
__getitem__(item)Get Spectrum data.
add_channels(add_list[, force_update_info])Append new channels from other MNE objects to the instance.
add_reference_channels(ref_channels)Add reference channels to data that consists of all zeros.
copy()Return copy of the Spectrum instance.
drop_channels(ch_names[, on_missing])Drop channel(s).
get_channel_types([picks, unique, only_data_chs])Get a list of channel type for each channel.
get_data([picks, exclude, fmin, fmax, ...])Get spectrum data in NumPy array format.
pick(picks[, exclude, verbose])Pick a subset of channels.
pick_channels(ch_names[, ordered, verbose])pick_types([meg, eeg, stim, eog, ecg, emg, ...])plot(*[, picks, average, dB, amplitude, ...])Plot power or amplitude spectra.
plot_topo(*[, dB, layout, color, ...])Plot power spectral density, separately for each channel.
plot_topomap([bands, ch_type, normalize, ...])Plot scalp topography of PSD for chosen frequency bands.
reorder_channels(ch_names)Reorder channels.
save(fname, *[, overwrite, verbose])Save spectrum data to disk (in HDF5 format).
to_data_frame([picks, index, copy, ...])Export data in tabular structure as a pandas DataFrame.
units([latex])Get the spectrum units for each channel type.
See also
References
- __contains__(ch_type)[source]#
Check channel type membership.
- Parameters:
- ch_type
str Channel type to check for. Can be e.g.
'meg','eeg','stim', etc.
- ch_type
- Returns:
- inbool
Whether or not the instance contains the given channel type.
Examples
Channel type membership can be tested as:
>>> 'meg' in inst
True
>>> 'seeg' in inst
False
- __getitem__(item)[source]#
Get Spectrum data.
- Parameters:
- item
int|slice| array_like Indexing is similar to a
NumPy array; see Notes.
- item
- Returns:
- %(getitem_spectrum_return)s
Notes
Integer-, list-, and slice-based indexing is possible:
spectrum[0]gives all frequency bins in the first channelspectrum[:3]gives all frequency bins in the first 3 channelsspectrum[[0, 2], 5]gives the value in the sixth frequency bin of the first and third channelsspectrum[(4, 7)]is the same asspectrum[4, 7].
- add_channels(add_list, force_update_info=False)[source]#
Append new channels from other MNE objects to the instance.
- Parameters:
- add_list
list A list of MNE objects to append to the current instance. The channels contained in the other instances are appended to the channels of the current instance. Therefore, all other instances must be of the same type as the current object. See notes on how to add data coming from an array.
- force_update_infobool
If True, force the info for objects to be appended to match the values of the current instance. This should generally only be used when adding stim channels for which important metadata won’t be overwritten.
New in v0.12.
- add_list
- Returns:
- instsame
typeas the input data The modified instance.
- instsame
See also
Notes
If
selfis a Raw instance that has been preloaded into anumpy.memmapinstance, the memmap will be resized.This function expects an MNE object to be appended (e.g.
Raw,Epochs,Evoked). If you simply want to add a channel based on values of an np.ndarray, you need to create aRawArray. See <https://mne.tools/mne-project-template/auto_examples/plot_mne_objects_from_arrays.html>`_
- add_reference_channels(ref_channels)[source]#
Add reference channels to data that consists of all zeros.
Adds reference channels to data that were not included during recording. This is useful when you need to re-reference your data to different channels. These added channels will consist of all zeros.
- property compensation_grade#
The current gradient compensation grade.
- copy()[source]#
Return copy of the Spectrum instance.
- Returns:
- spectruminstance of
Spectrum A copy of the object.
- spectruminstance of
- drop_channels(ch_names, on_missing='raise')[source]#
Drop channel(s).
- Parameters:
- Returns:
- instsame
typeas the input data The modified instance.
- instsame
See also
Notes
New in v0.9.0.
- get_channel_types(picks=None, unique=False, only_data_chs=False)[source]#
Get a list of channel type for each channel.
- Parameters:
- picks
str| array_like |slice|None Channels to include. Slices and lists of integers will be interpreted as channel indices. In lists, channel type strings (e.g.,
['meg',
'eeg']
) will pick channels of those types, channel name strings (e.g.,['MEG0111', 'MEG2623']will pick the given channels. Can also be the string values'all'to pick all channels, or'data'to pick data channels. None (default) will pick all channels. Bad channels are included by default. Note that channels ininfo['bads']will be included if their names or indices are explicitly provided.- uniquebool
Whether to return only unique channel types. Default is
False.- only_data_chsbool
Whether to ignore non-data channels. Default is
False.
- picks
- Returns:
- channel_types
list The channel types.
- channel_types
- get_data(picks=None, exclude='bads', fmin=0, fmax=inf, return_freqs=False)[source]#
Get spectrum data in NumPy array format.
- Parameters:
- picks
str| array_like |slice|None Channels to include. Slices and lists of integers will be interpreted as channel indices. In lists, channel type strings (e.g.,
['meg',
'eeg']
) will pick channels of those types, channel name strings (e.g.,['MEG0111', 'MEG2623']will pick the given channels. Can also be the string values'all'to pick all channels, or'data'to pick data channels. None (default) will pick good data channels (excluding reference MEG channels). Note that channels ininfo['bads']will be included if their names or indices are explicitly provided.- exclude
listofstr| ‘bads’ Channel names to exclude. If
'bads', channels inspectrum.info['bads']are excluded; pass an empty list to include all channels (including “bad” channels, if any).- fmin, fmax
float The lower- and upper-bound on frequencies of interest. Default is
fmin=0, fmax=np.inf(spans all frequencies present in the data).- return_freqsbool
Whether to return the frequency bin values for the requested frequency range. Default is
False.
- picks
- Returns:
Examples using
get_data:
- pick(picks, exclude=(), *, verbose=None)[source]#
Pick a subset of channels.
- Parameters:
- picks
str| array_like |slice|None Channels to include. Slices and lists of integers will be interpreted as channel indices. In lists, channel type strings (e.g.,
['meg',
'eeg']
) will pick channels of those types, channel name strings (e.g.,['MEG0111', 'MEG2623']will pick the given channels. Can also be the string values'all'to pick all channels, or'data'to pick data channels. None (default) will pick all channels. Bad channels are included by default. Note that channels ininfo['bads']will be included if their names or indices are explicitly provided.- exclude
list|str Set of channels to exclude, only used when picking based on types (e.g., exclude=”bads” when picks=”meg”).
- verbosebool |
str|int|None Control verbosity of the logging output. If
None, use the default verbosity level. See the logging documentation andmne.verbose()for details. Should only be passed as a keyword argument.New in v0.24.0.
- picks
- Returns:
- instsame
typeas the input data The modified instance.
- instsame
Examples using
pick:
- pick_channels(ch_names, ordered=True, *, verbose=None)[source]#
Warning
LEGACY: New code should use inst.pick(…).
Pick some channels.
- Parameters:
- ch_names
list The list of channels to select.
- orderedbool
If True (default), ensure that the order of the channels in the modified instance matches the order of
ch_names.New in v0.20.0.
Changed in version 1.7: The default changed from False in 1.6 to True in 1.7.
- verbosebool |
str|int|None Control verbosity of the logging output. If
None, use the default verbosity level. See the logging documentation andmne.verbose()for details. Should only be passed as a keyword argument.New in v1.1.
- ch_names
- Returns:
- instsame
typeas the input data The modified instance.
- instsame
See also
Notes
If
orderedisFalse, the channel names given viach_namesare assumed to be a set, that is, their order does not matter. In that case, the original order of the channels in the data is preserved. Apart from usingordered=True, you may also usereorder_channelsto set channel order, if necessary.New in v0.9.0.
- pick_types(meg=False, eeg=False, stim=False, eog=False, ecg=False, emg=False, ref_meg='auto', *, misc=False, resp=False, chpi=False, exci=False, ias=False, syst=False, seeg=False, dipole=False, gof=False, bio=False, ecog=False, fnirs=False, csd=False, dbs=False, temperature=False, gsr=False, eyetrack=False, include=(), exclude='bads', selection=None, verbose=None)[source]#
Warning
LEGACY: New code should use inst.pick(…).
Pick some channels by type and names.
- Parameters:
- megbool |
str If True include MEG channels. If string it can be ‘mag’, ‘grad’, ‘planar1’ or ‘planar2’ to select only magnetometers, all gradiometers, or a specific type of gradiometer.
- eegbool
If True include EEG channels.
- stimbool
If True include stimulus channels.
- eogbool
If True include EOG channels.
- ecgbool
If True include ECG channels.
- emgbool
If True include EMG channels.
- ref_megbool |
str If True include CTF / 4D reference channels. If ‘auto’, reference channels are included if compensations are present and
megis not False. Can also be the string options for themegparameter.- miscbool
If True include miscellaneous analog channels.
- respbool
If
Trueinclude respiratory channels.- chpibool
If True include continuous HPI coil channels.
- excibool
Flux excitation channel used to be a stimulus channel.
- iasbool
Internal Active Shielding data (maybe on Triux only).
- systbool
System status channel information (on Triux systems only).
- seegbool
Stereotactic EEG channels.
- dipolebool
Dipole time course channels.
- gofbool
Dipole goodness of fit channels.
- biobool
Bio channels.
- ecogbool
Electrocorticography channels.
- fnirsbool |
str Functional near-infrared spectroscopy channels. If True include all fNIRS channels. If False (default) include none. If string it can be ‘hbo’ (to include channels measuring oxyhemoglobin) or ‘hbr’ (to include channels measuring deoxyhemoglobin).
- csdbool
EEG-CSD channels.
- dbsbool
Deep brain stimulation channels.
- temperaturebool
Temperature channels.
- gsrbool
Galvanic skin response channels.
- eyetrackbool |
str Eyetracking channels. If True include all eyetracking channels. If False (default) include none. If string it can be ‘eyegaze’ (to include eye position channels) or ‘pupil’ (to include pupil-size channels).
- include
listofstr List of additional channels to include. If empty do not include any.
- exclude
listofstr|str List of channels to exclude. If ‘bads’ (default), exclude channels in
info['bads'].- selection
listofstr Restrict sensor channels (MEG, EEG, etc.) to this list of channel names.
- verbosebool |
str|int|None Control verbosity of the logging output. If
None, use the default verbosity level. See the logging documentation andmne.verbose()for details. Should only be passed as a keyword argument.
- megbool |
- Returns:
- instsame
typeas the input data The modified instance.
- instsame
See also
Notes
New in v0.9.0.
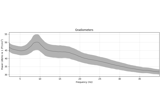
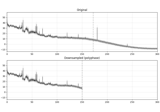
- plot(*, picks=None, average=False, dB=True, amplitude=False, xscale='linear', ci='sd', ci_alpha=0.3, color='black', alpha=None, spatial_colors=True, sphere=None, exclude=(), axes=None, show=True)[source]#
Plot power or amplitude spectra.
Separate plots are drawn for each channel type. When the data have been processed with a bandpass, lowpass or highpass filter, dashed lines (╎) indicate the boundaries of the filter. The line noise frequency is also indicated with a dashed line (⋮). If
average=False, the plot will be interactive, and click-dragging on the spectrum will generate a scalp topography plot for the chosen frequency range in a new figure.- Parameters:
- picks
str| array_like |slice|None Channels to include. Slices and lists of integers will be interpreted as channel indices. In lists, channel type strings (e.g.,
['meg',
'eeg']
) will pick channels of those types, channel name strings (e.g.,['MEG0111', 'MEG2623']will pick the given channels. Can also be the string values'all'to pick all channels, or'data'to pick data channels. None (default) will pick all data channels (excluding reference MEG channels). Note that channels ininfo['bads']will be included if their names or indices are explicitly provided.Changed in version 1.5: In version 1.5, the default behavior changed so that all data channels (not just “good” data channels) are shown by default.
- averagebool
Whether to average across channels before plotting. If
True, interactive plotting of scalp topography is disabled, and parametersciandci_alphacontrol the style of the confidence band around the mean. Default isFalse.- dBbool
Whether to plot on a decibel scale. If
True, plots 10 × log₁₀(spectral_power/Hz), or 20 × log₁₀(spectral amplitude/√Hz) ifamplitude=True.- amplitudebool
Whether to plot an amplitude spectrum (
True) or power spectrum (False).Changed in version 1.8: In version 1.8, the default changed to
amplitude=False.- xscale‘linear’ | ‘log’
Scale of the frequency axis. Default is
'linear'.- ci
float| ‘sd’ | ‘range’ |None Type of confidence band drawn around the mean when
average=True. If'sd'the band spans ±1 standard deviation across channels. If'range'the band spans the range across channels at each frequency. If afloat, it indicates the (bootstrapped) confidence interval to display, and must satisfy0 < ci <= 100. IfNone, no band is drawn. Default issd.- ci_alpha
float Opacity of the confidence band. Must satisfy
0 <= ci_alpha <= 1. Default is 0.3.- color
str|tuple A matplotlib-compatible color to use. Has no effect when spatial_colors=True.
- alpha
float|None Opacity of the spectrum line(s). If
float, must satisfy0 <= alpha <= 1. IfNone, opacity will be1whenaverage=Trueand0.1whenaverage=False. Default isNone.- spatial_colorsbool
Whether to color spectrum lines by channel location. Ignored if
average=True.- sphere
float| array_like offloat| instance ofConductorModel|str|listofstr|None The sphere parameters to use for the head outline. Can be array-like of shape (4,) to give the X/Y/Z origin and radius in meters, or a single float to give just the radius (origin assumed 0, 0, 0). Can also be an instance of a spherical
ConductorModelto use the origin and radius from that object. Can also be astr, in which case:'auto': the sphere is fit to external digitization points first, and to external + EEG digitization points if the former fails.'eeglab': the head circle is defined by EEG electrodes'Fpz','Oz','T7', and'T8'(if'Fpz'is not present, it will be approximated from the coordinates of'Oz').'extra': the sphere is fit to external digitization points.'eeg': the sphere is fit to EEG digitization points.'cardinal': the sphere is fit to cardinal digitization points.'hpi': the sphere is fit to HPI coil digitization points.
Can also be a list of
str, in which case the sphere is fit to the specified digitization points, which can be any combination of'extra','eeg','cardinal', and'hpi', as specified above.None(the default) is equivalent to'auto'when enough extra digitization points are available, and (0, 0, 0, 0.095) otherwise.New in v0.20.
Changed in version 1.1: Added
'eeglab'option.Changed in version 1.11: Added
'extra','eeg','cardinal','hpi'and list ofstroptions.- exclude
listofstr| ‘bads’ Channel names to exclude from being drawn. If
'bads', channels inspectrum.info['bads']are excluded; pass an empty list to include all channels (including “bad” channels, if any).Changed in version 1.5: In version 1.5, the default behavior changed from
exclude='bads'toexclude=().- axesinstance of
Axes|listofAxes|None The axes to plot into. If
None, a newFigurewill be created with the correct number of axes. IfAxesare provided (either as a single instance or alistof axes), the number of axes provided must match the length ofbands. Default isNone.- showbool
Show the figure if
True.
- picks
- Returns:
- figinstance of
matplotlib.figure.Figure Figure with spectra plotted in separate subplots for each channel type.
- figinstance of
Examples using
plot: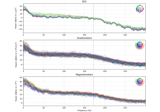
The Spectrum and EpochsSpectrum classes: frequency-domain data
The Spectrum and EpochsSpectrum classes: frequency-domain data
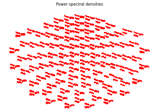
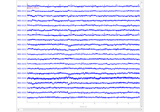
- plot_topo(*, dB=True, layout=None, color='w', fig_facecolor='k', axis_facecolor='k', axes=None, block=False, show=True)[source]#
Plot power spectral density, separately for each channel.
- Parameters:
- dBbool
Whether to plot on a decibel scale. If
True, plots 10 × log₁₀(spectral_power/Hz).- layoutinstance of
Layout|None Layout instance specifying sensor positions (does not need to be specified for Neuromag data). If
None(default), the layout is inferred from the data (if possible).- color
str|tuple A matplotlib-compatible color to use for the curves. Defaults to white.
- fig_facecolor
str|tuple A matplotlib-compatible color to use for the figure background. Defaults to black.
- axis_facecolor
str|tuple A matplotlib-compatible color to use for the axis background. Defaults to black.
- axesinstance of
Axes|listofAxes|None The axes to plot into. If
None, a newFigurewill be created with the correct number of axes. IfAxesare provided (either as a single instance or alistof axes), the number of axes provided must be length 1 (for efficiency, subplots for each channel are simulated within a singleAxesobject). Default isNone.- blockbool
Whether to halt program execution until the figure is closed. May not work on all systems / platforms. Defaults to
False.- showbool
Show the figure if
True.
- Returns:
- figinstance of
matplotlib.figure.Figure Figure distributing one image per channel across sensor topography.
- figinstance of
Examples using
plot_topo:
The Spectrum and EpochsSpectrum classes: frequency-domain data
The Spectrum and EpochsSpectrum classes: frequency-domain data
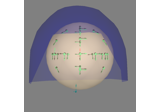
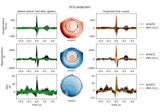
- plot_topomap(bands=None, ch_type=None, *, normalize=False, agg_fun=None, dB=False, sensors=True, show_names=False, mask=None, mask_params=None, contours=6, outlines='head', sphere=None, image_interp='cubic', extrapolate='auto', border='mean', res=64, size=1, cmap=None, vlim=(None, None), cnorm=None, colorbar=True, cbar_fmt='auto', units=None, axes=None, show=True)[source]#
Plot scalp topography of PSD for chosen frequency bands.
- Parameters:
- bands
None|dict|listoftuple The frequencies or frequency ranges to plot. If a
dict, keys will be used as subplot titles and values should be either a single frequency (e.g.,{'presentation rate': 6.5}) or a length-two sequence of lower and upper frequency band edges (e.g.,{'theta': (4, 8)}). If a single frequency is provided, the plot will show the frequency bin that is closest to the requested value. IfNone(the default), expands to:bands = {'Delta (0-4 Hz)': (0, 4), 'Theta (4-8 Hz)': (4, 8), 'Alpha (8-12 Hz)': (8, 12), 'Beta (12-30 Hz)': (12, 30), 'Gamma (30-45 Hz)': (30, 45)}
Note
For backwards compatibility,
tuplesof length 2 or 3 are also accepted, where the last element of the tuple is the subplot title and the other entries are frequency values (a single value or band edges). New code should usedictorNone.Changed in version 1.2: Allow passing a dict and discourage passing tuples.
- ch_type‘mag’ | ‘grad’ | ‘planar1’ | ‘planar2’ | ‘eeg’ |
None The channel type to plot. For
'grad', the gradiometers are collected in pairs and the mean for each pair is plotted. IfNonethe first available channel type from order shown above is used. Defaults toNone.- normalizebool
If True, each band will be divided by the total power. Defaults to False.
- agg_fun
callable() The function used to aggregate over frequencies. Defaults to
numpy.sum()ifnormalize=True, elsenumpy.mean().- dBbool
Whether to plot on a decibel scale. If
True, plots 10 × log₁₀(spectral_power/Hz), following the application ofagg_fun. Ignored ifnormalize=True.- sensorsbool |
str Whether to add markers for sensor locations. If
str, should be a valid matplotlib format string (e.g.,'r+'for red plusses, see the Notes section ofplot()). IfTrue(the default), black circles will be used.- show_namesbool |
callable() If
True, show channel names next to each sensor marker. If callable, channel names will be formatted using the callable; e.g., to delete the prefix ‘MEG ‘ from all channel names, pass the functionlambda x: x.replace('MEG ', ''). Ifmaskis notNone, only non-masked sensor names will be shown.- mask
ndarrayof bool, shape (n_channels, n_times) |None Array indicating channel-time combinations to highlight with a distinct plotting style (useful for, e.g. marking which channels at which times a statistical test of the data reaches significance). Array elements set to
Truewill be plotted with the parameters given inmask_params. Defaults toNone, equivalent to an array of allFalseelements.- mask_params
dict|None Additional plotting parameters for plotting significant sensors. Default (None) equals:
dict(marker='o', markerfacecolor='w', markeredgecolor='k',
        linewidth=0, markersize=4)
- contours
int| array_like The number of contour lines to draw. If
0, no contours will be drawn. If a positive integer, that number of contour levels are chosen using the matplotlib tick locator (may sometimes be inaccurate, use array for accuracy). If array-like, the array values are used as the contour levels. The values should be in µV for EEG, fT for magnetometers and fT/m for gradiometers. Ifcolorbar=True, the colorbar will have ticks corresponding to the contour levels. Default is6.- outlines‘head’ |
dict|None The outlines to be drawn. If ‘head’, the default head scheme will be drawn. If dict, each key refers to a tuple of x and y positions, the values in ‘mask_pos’ will serve as image mask. Alternatively, a matplotlib patch object can be passed for advanced masking options, either directly or as a function that returns patches (required for multi-axis plots). If None, nothing will be drawn. Defaults to ‘head’.
- sphere
float| array_like offloat| instance ofConductorModel|str|listofstr|None The sphere parameters to use for the head outline. Can be array-like of shape (4,) to give the X/Y/Z origin and radius in meters, or a single float to give just the radius (origin assumed 0, 0, 0). Can also be an instance of a spherical
ConductorModelto use the origin and radius from that object. Can also be astr, in which case:'auto': the sphere is fit to external digitization points first, and to external + EEG digitization points if the former fails.'eeglab': the head circle is defined by EEG electrodes'Fpz','Oz','T7', and'T8'(if'Fpz'is not present, it will be approximated from the coordinates of'Oz').'extra': the sphere is fit to external digitization points.'eeg': the sphere is fit to EEG digitization points.'cardinal': the sphere is fit to cardinal digitization points.'hpi': the sphere is fit to HPI coil digitization points.
Can also be a list of
str, in which case the sphere is fit to the specified digitization points, which can be any combination of'extra','eeg','cardinal', and'hpi', as specified above.None(the default) is equivalent to'auto'when enough extra digitization points are available, and (0, 0, 0, 0.095) otherwise.New in v0.20.
Changed in version 1.1: Added
'eeglab'option.Changed in version 1.11: Added
'extra','eeg','cardinal','hpi'and list ofstroptions.- image_interp
str The image interpolation to be used. Options are
'cubic'(default) to usescipy.interpolate.CloughTocher2DInterpolator,'nearest'to usescipy.spatial.Voronoior'linear'to usescipy.interpolate.LinearNDInterpolator.- extrapolate
str Options:
'box'Extrapolate to four points placed to form a square encompassing all data points, where each side of the square is three times the range of the data in the respective dimension.
'local'(default for MEG sensors)Extrapolate only to nearby points (approximately to points closer than median inter-electrode distance). This will also set the mask to be polygonal based on the convex hull of the sensors.
'head'(default for non-MEG sensors)Extrapolate out to the edges of the clipping circle. This will be on the head circle when the sensors are contained within the head circle, but it can extend beyond the head when sensors are plotted outside the head circle.
- border
float| ‘mean’ Value to extrapolate to on the topomap borders. If
'mean'(default), then each extrapolated point has the average value of its neighbours.- res
int The resolution of the topomap image (number of pixels along each side).
- size
float Side length of each subplot in inches.
- cmapmatplotlib colormap | (colormap, bool) | ‘interactive’ |
None Colormap to use. If
tuple, the first value indicates the colormap to use and the second value is a boolean defining interactivity. In interactive mode the colors are adjustable by clicking and dragging the colorbar with left and right mouse button. Left mouse button moves the scale up and down and right mouse button adjusts the range. Hitting space bar resets the range. Up and down arrows can be used to change the colormap. IfNone,'Reds'is used for data that is either all-positive or all-negative, and'RdBu_r'is used otherwise.'interactive'is equivalent to(None, True). Defaults toNone.Warning
Interactive mode works smoothly only for a small amount of topomaps. Interactive mode is disabled by default for more than 2 topomaps.
- vlim
tupleof length 2 | “joint” Lower and upper bounds of the colormap, typically a numeric value in the same units as the data. Elements of the
tuplemay also be callable functions which take in aNumPy arrayand return a scalar.If both entries are
None, the bounds are set at ± the maximum absolute value of the data (yielding a colormap with midpoint at 0), or(0, max(abs(data)))if the (possibly baselined) data are all-positive. ProvidingNonefor just one entry will set the corresponding boundary at the min/max of the data. Ifvlim="joint", will compute the colormap limits jointly across all topomaps of the same channel type (instead of separately for each topomap), using the min/max of the data for that channel type. Defaults to(None, None).- cnorm
matplotlib.colors.Normalize|None How to normalize the colormap. If
None, standard linear normalization is performed. If notNone,vminandvmaxwill be ignored. See Matplotlib docs for more details on colormap normalization, and the ERDs example for an example of its use.- colorbarbool
Plot a colorbar in the rightmost column of the figure.
- cbar_fmt
str Formatting string for colorbar tick labels. See Format specification mini-language for details. If
'auto', is equivalent to ‘%0.3f’ ifdB=Falseand ‘%0.1f’ ifdB=True. Defaults to'auto'.- units
str|None The units to use for the colorbar label. Ignored if
colorbar=False. IfNonethe label will be “AU” indicating arbitrary units. Default isNone.- axesinstance of
Axes|listofAxes|None The axes to plot into. If
None, a newFigurewill be created with the correct number of axes. IfAxesare provided (either as a single instance or alistof axes), the number of axes provided must match the length ofbands. Default isNone.- showbool
Show the figure if
True.
- bands
- Returns:
- figinstance of
Figure Figure showing one scalp topography per frequency band.
- figinstance of
Examples using
plot_topomap:
The Spectrum and EpochsSpectrum classes: frequency-domain data
The Spectrum and EpochsSpectrum classes: frequency-domain data
- reorder_channels(ch_names)[source]#
Reorder channels.
- Parameters:
- ch_names
list The desired channel order.
- ch_names
- Returns:
- instsame
typeas the input data The modified instance.
- instsame
See also
Notes
Channel names must be unique. Channels that are not in
ch_namesare dropped.New in v0.16.0.
- save(fname, *, overwrite=False, verbose=None)[source]#
Save spectrum data to disk (in HDF5 format).
- Parameters:
- fnamepath-like
Path of file to save to.
- overwritebool
If True (default False), overwrite the destination file if it exists.
- verbosebool |
str|int|None Control verbosity of the logging output. If
None, use the default verbosity level. See the logging documentation andmne.verbose()for details. Should only be passed as a keyword argument.
See also
- to_data_frame(picks=None, index=None, copy=True, long_format=False, *, verbose=None)[source]#
Export data in tabular structure as a pandas DataFrame.
Channels are converted to columns in the DataFrame. By default, an additional column “freq” is added, unless
index='freq'(in which case frequency values form the DataFrame’s index).- Parameters:
- picks
str| array_like |slice|None Channels to include. Slices and lists of integers will be interpreted as channel indices. In lists, channel type strings (e.g.,
['meg',
'eeg']
) will pick channels of those types, channel name strings (e.g.,['MEG0111', 'MEG2623']will pick the given channels. Can also be the string values'all'to pick all channels, or'data'to pick data channels. None (default) will pick all channels. Bad channels are included by default. Note that channels ininfo['bads']will be included if their names or indices are explicitly provided.- index
str|listofstr|None Kind of index to use for the DataFrame. If
None, a sequential integer index (pandas.RangeIndex) will be used. If astr, apandas.Indexwill be used (see Notes). If a list of two or more string values, apandas.MultiIndexwill be used. Defaults toNone.- copybool
If
True, data will be copied. Otherwise data may be modified in place. Defaults toTrue.- long_formatbool
If True, the DataFrame is returned in long format where each row is one observation of the signal at a unique combination of frequency and channel. For convenience, a
ch_typecolumn is added to facilitate subsetting the resulting DataFrame. Defaults toFalse.- verbosebool |
str|int|None Control verbosity of the logging output. If
None, use the default verbosity level. See the logging documentation andmne.verbose()for details. Should only be passed as a keyword argument.
- picks
- Returns:
- dfinstance of
pandas.DataFrame A dataframe suitable for usage with other statistical/plotting/analysis packages.
- dfinstance of
Notes
Valid values for
indexdepend on whether the Spectrum was created from continuous data (Raw,Evoked) or discontinuous data (Epochs). For continuous data, onlyNoneor'freq'is supported. For discontinuous data, additional valid values are'epoch'and'condition', or alistcomprising some of the valid string values (e.g.,['freq', 'epoch']).
Examples using mne.time_frequency.Spectrum#
Preprocessing optically pumped magnetometer (OPM) MEG data
The Spectrum and EpochsSpectrum classes: frequency-domain data